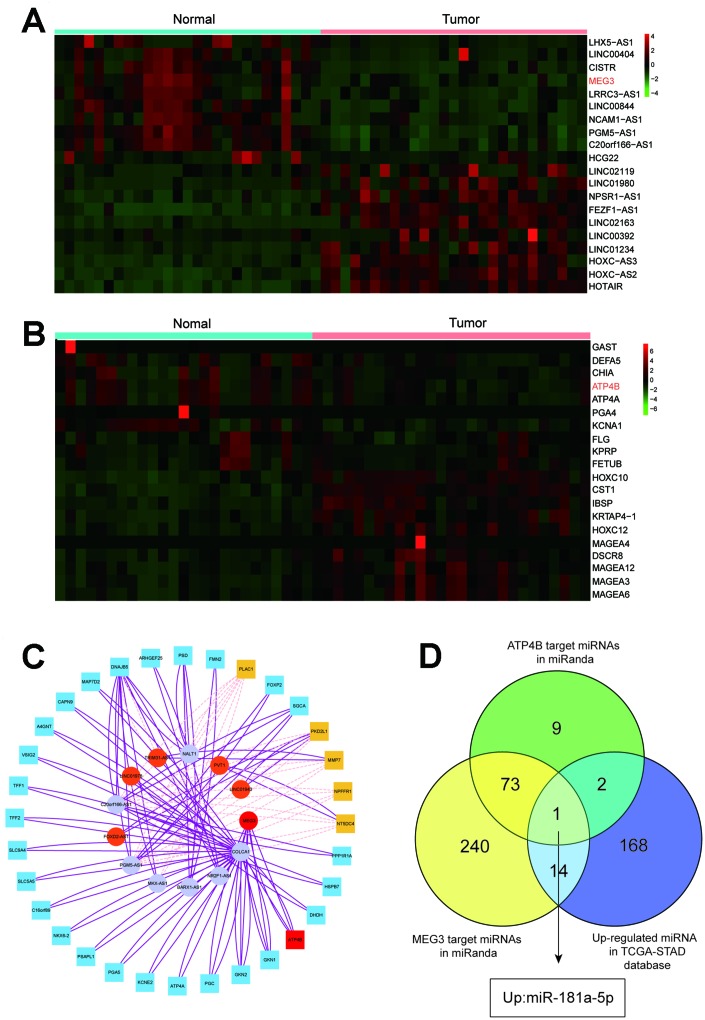
Figure 1.
Heat map analysis and target gene prediction. (A) Heat map analysis showed that MEG3 was downregulated among the top 20 differentially expressed lncRNAs in GC tissues and adjacent normal tissues. (B) Heat map analysis showed that the expression of ATP4B was reduced among the top 20 differentially expressed mRNAs between GC tissues and adjacent normal tissues. (C) The network of the relationships between the top twelve differentially expressed genes in lncRNA and the top thirty differentially expressed genes in mRNA. (D) MEG3 and ATP4B are highlighted in a Venn analysis of miRNA associated with gastric cancer from the TCGA database.

