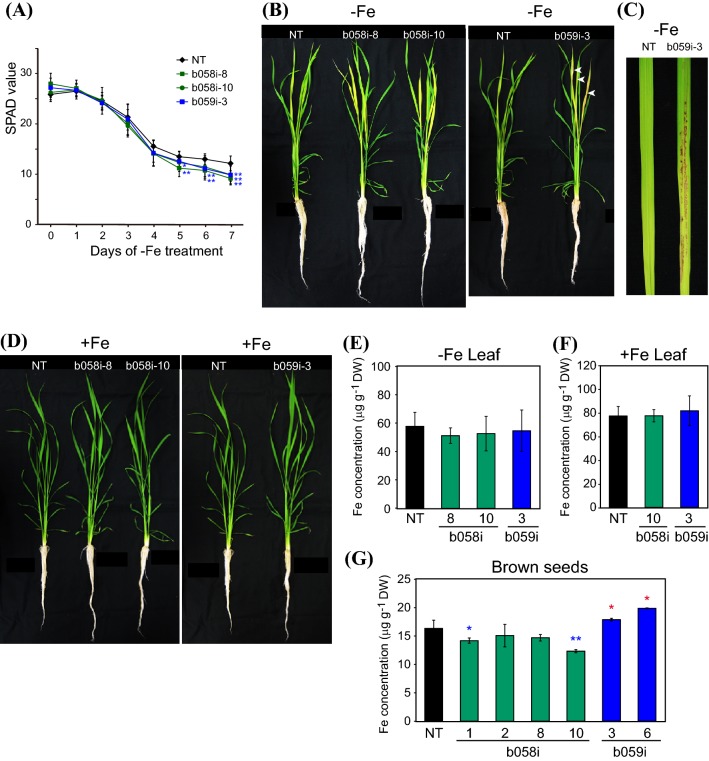
Fig. 7.
Fe deficiency tolerance of OsbHLH058 and OsbHLH059 knockdown plants produced by RNA interference. a Fe deficiency tolerance in hydroponic culture. Relative chlorophyll contents (SPAD values) of the newest leaves were measured after the onset of Fe deficiency treatment. b Representative plants on day 7 of Fe-deficient hydroponic culture. Three plants were bundled for culture of each line. White arrowheads indicate representative positions of brown spots in the newest leaves. c Representative newest leaves on day 7 of Fe-deficient hydroponic culture. d Representative plants on day 7 of Fe-sufficient hydroponic culture. Three plants were bundled for culture of each line. e, f Fe concentration in leaf blades after Fe-deficient (e) or -sufficient (f) hydroponic culture for 7 d. g Fe concentration in brown seeds after pot culture in Fe-sufficient soil. NT, non-transformant; b058i, OsbHLH058 knockdown lines; b059i, OsbHLH059 knockdown lines produced by RNA interference. Means ± SD are shown (a n = 12 for NT and b059i-3, n = 6 for b058i-8, n = 9 for b058i-10; e n = 4 for NT and b059i-3, n = 2 for b058i-8, n = 5 for b058i-10; f n = 3 for NT and b058i-10, n = 4 for b059i-3; g: n = 7 or NT, n = 3 for b058i-1, 8 and 10, n = 4 for b058i-2, n = 2 for b059i-3 and 6). Asterisks indicate significant differences compared to NT at each time point and condition (two-sample Student’s t-test; *P < 0.05; **P < 0.01)

