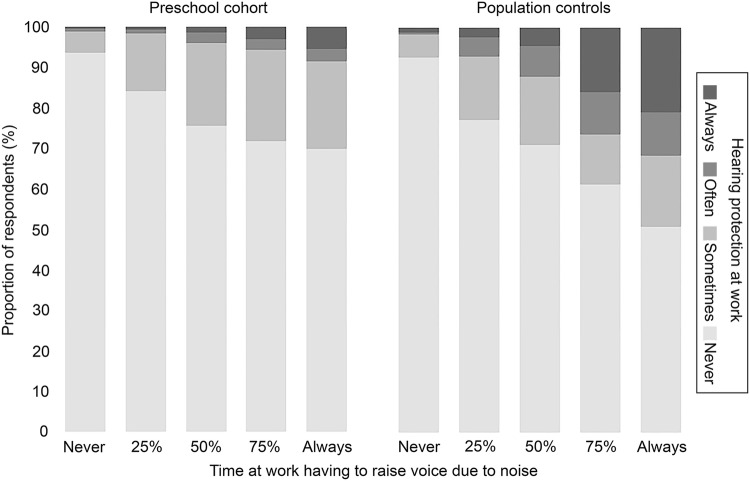
Fig. 2.
Use of hearing protection at work (frequency of use shown in different shades of grey) in relation to noise exposure at work (x-axis, time at work having to raise voice due to noise) shown as proportion of respondents (y-axis) in each noise exposure strata for the preschool cohort (left) and for population controls (right)

