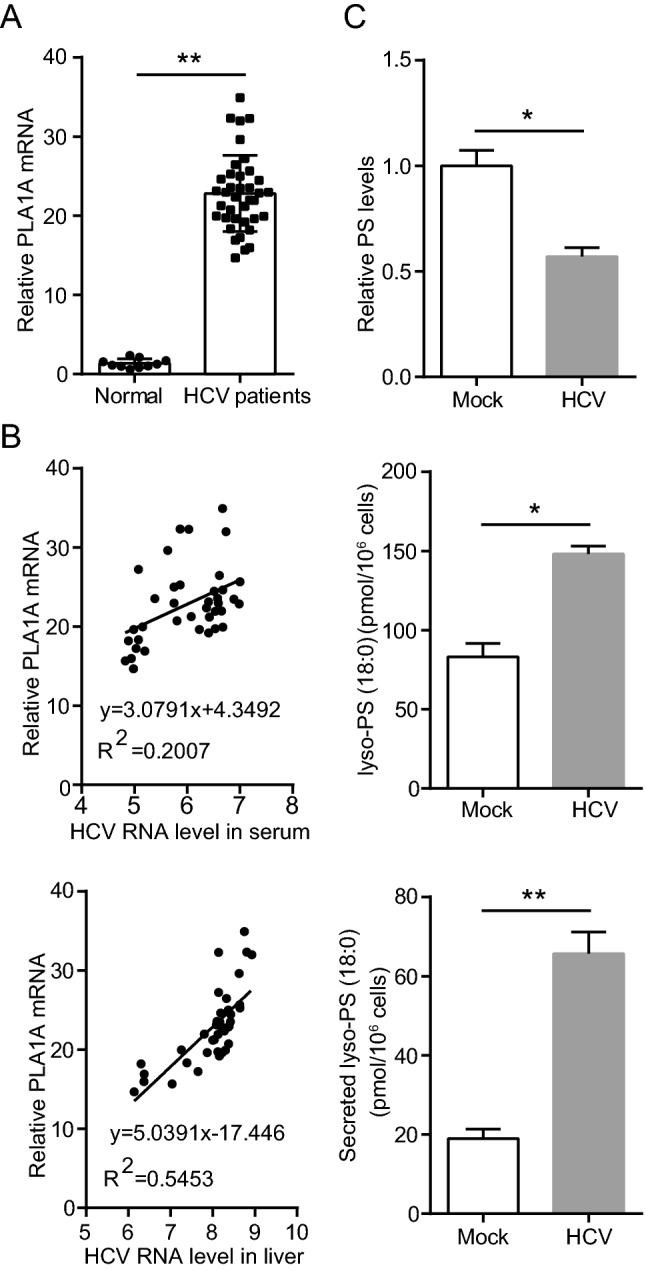
Fig. 1.

HCV infection upregulates host PLA1A expression. A Box plot diagrams show the PLA1A mRNA levels in liver biopsies of 10 normal control patients and 38 patients with chronic hepatitis C. B There is a positive correlation between PLA1A mRNA and HCV virus load in serum or liver. C Levels of phosphatidylserine (PS), lyso-PS (18:0), and secreted lyso-PS (18:0) at the indicated time points. Data are presented as means ± SDs. *P < 0.05; **P < 0.001.
