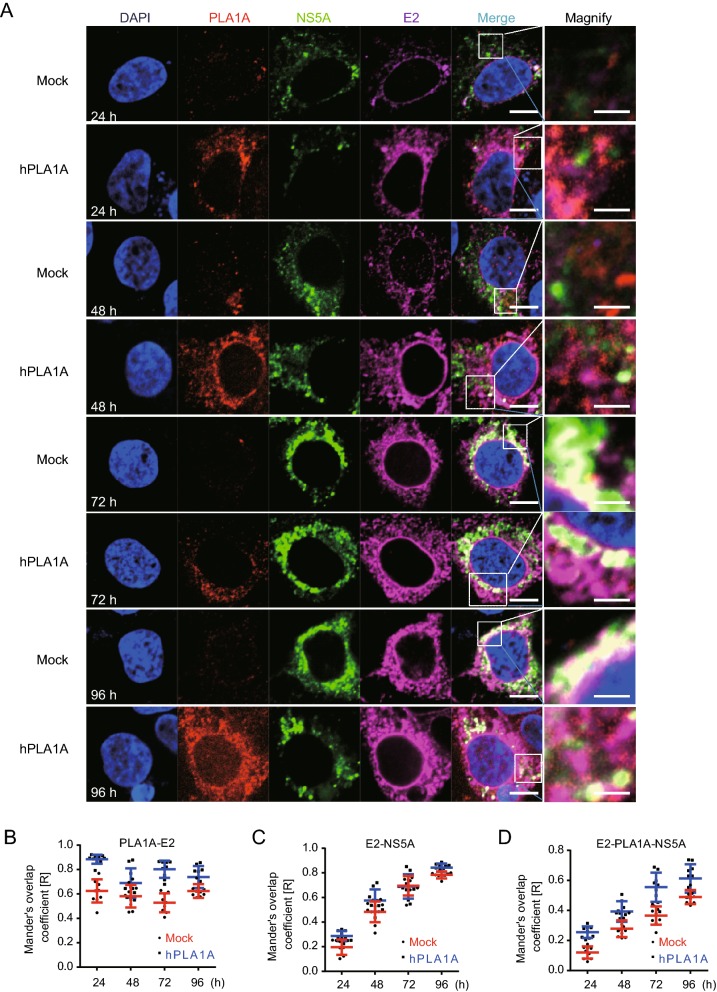
Fig. 9.
Kinetics of subcellular distribution and colocalization of PLA1A with E2 and NS5A. A Control cells and Huh7.5.1 cells stably overexpressing PLA1A were electroporated with HCV J399EM RNA and at the indicated times post-electroporation, cells were fixed and probed with antibodies against the PLA1A, and E2 for indirect immunofluorescence analysis. NS5A carried green fluorescence protein. The nuclei were stained with DAPI. Scale bars represent 10 μm or 5 μm in regular and magnified images, respectively. B–D The degree of colocalization of PLA1A with given viral proteins was quantified. Each dot in the graph corresponds to one cell.

