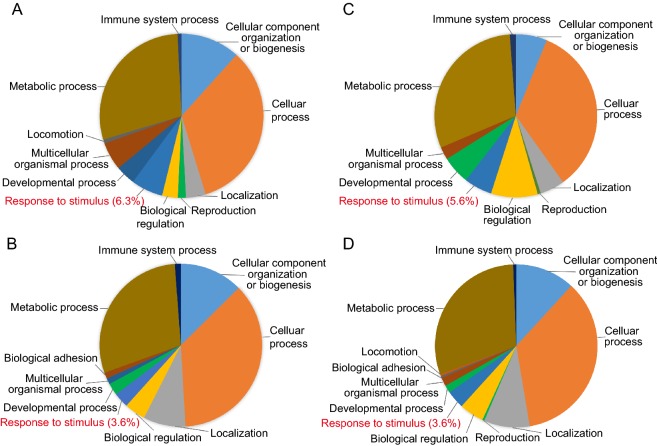
Fig. 2.
Functional classification analysis. List of regulated total proteins and phosphoproteins were submitted to PANTHER to perform a gene classification analysis. A Upregulated total proteins, B downregulated total proteins, C upregulated phosphoproteins, D downregulated phosphoproteins. Different colors represent different biological processes; area of fans represent the number of included proteins. “response to stimulus” was highlighted in red.

