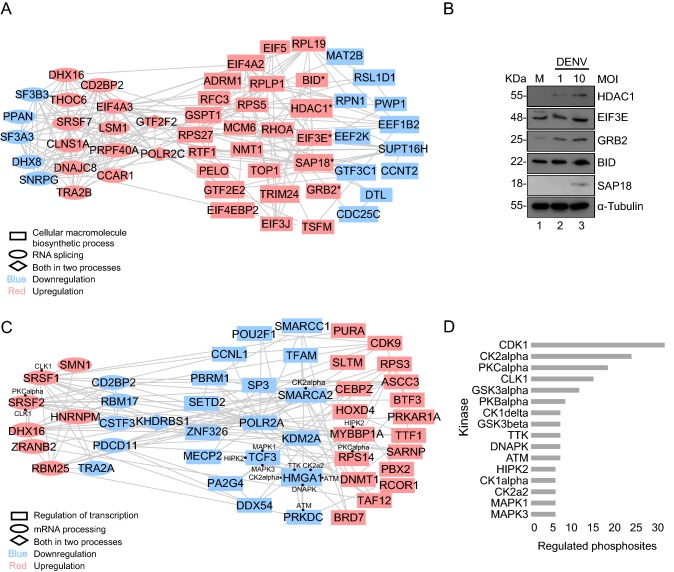
Fig. 4.
Protein–protein interaction network of regulated protein. List of “Cellular macromolecule biosynthetic process” and “RNA splicing” among total protein, “mRNA processing” and “Regulation of gene expression” among phosphoprotein were submitted to STRING to perform an interaction analysis and visualized by Cytoscape. A Network of “Cellular macromolecule biosynthetic process” and “RNA splicing” from regulated total proteins. The network includes 54 nodes (proteins) and 195 edges (interactions). Asterisk represents interested proteins. B Western blot validation of 5 interested genes. C Network of “mRNA processing” and “Regulation of gene expression” from regulated phosphoproteins. The network includes 48 nodes (proteins) and 133 edges (interactions). Black dot represents interacted predicted kinases. D Kinase prediction of regulated phosphoproteins.

