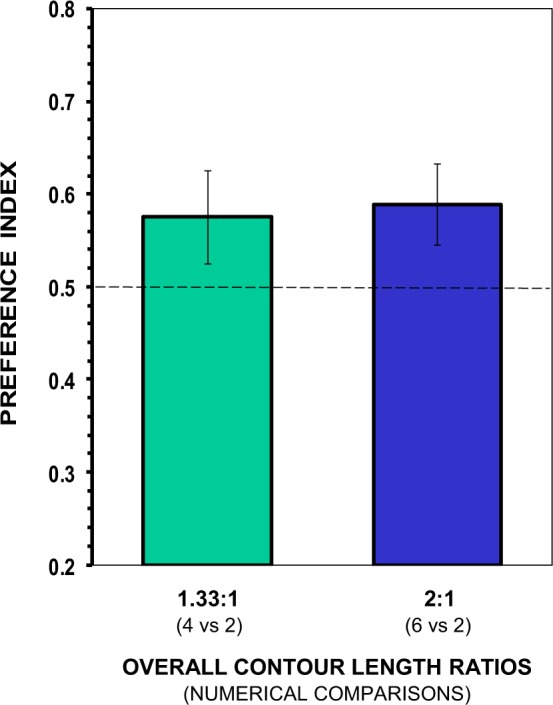
Figure 5.

Choice of angelfish as a function of the overall ratio of contour length of food items of the sets, when the numerically smaller set had a larger-sized food item and less overall contour length of the items than the larger set. Mean ± s.e.m. proportion of time (preference index) spent by test fish in the preference zone close to the smaller set containing a food item that doubled the size of the others. Values above 0.5 indicate a preference for the set with the larger-sized food item. No significant departure from the null hypothesis of no preference was found.
