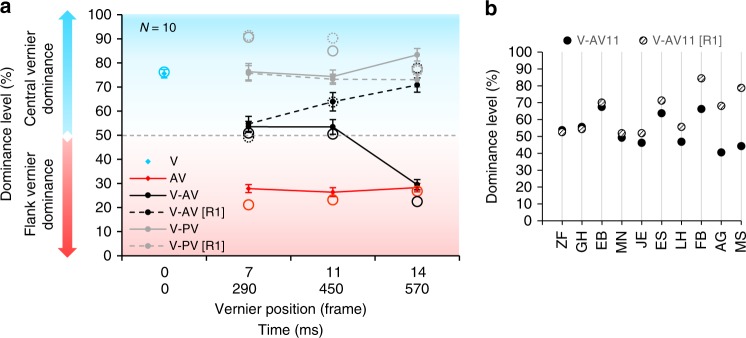
Fig. 2.
Results of experiment 1. a We presented the central vernier and, in addition, one flank vernier in frame 7, 11, or 14, respectively (290 ms, 450 ms, or 570 ms). Data is displayed as vernier dominance: the percentage of observers’ responses in accordance with the central vernier. A dominance level above 50% (blue part of the plot) indicates that the central vernier dominates performance; a dominance level below 50% (red part of the plot) indicates that the anti-vernier dominates performance. In the first part of the experiment, observers were naive (solid lines). In the second part of the experiment, they were informed about the paradigm and instructed to report the central vernier offset ([R1], dashed lines). Mandatory integration lasts up to 450 ms, depending on the observer. Performance of a two-stage model (see Fig. 5) is presented by empty circles. The experimental data is well predicted. Error bars represent s.e.m. b Performance when the anti-vernier was presented at 450 ms (frame 11) for each observer in the naive condition V-AV11 (filled disks) and the informed [R1] condition V-AV11 [R1] (hashed disks). About half of the observers were able to report the direction of the central offset only (V-AV11 [R1]; observers ES-MS), whereas integration was mandatory for the other participants (observers ZF-JE). Thus, different observers have different integration window durations. Source data are provided as a Source Data file

