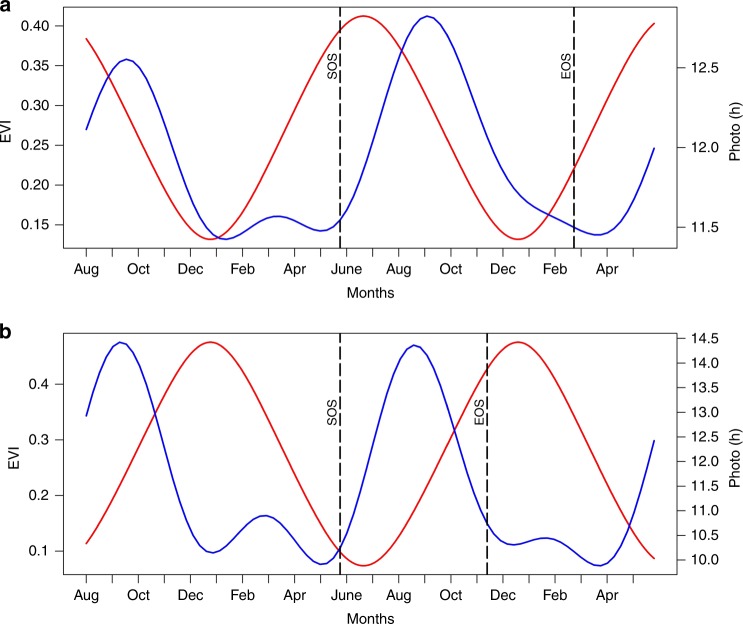
Fig. 4.
Example of pixel profile for a complete EVI and Photoperiod daily time-series: a Croplands in the Sudano-Sahel region showing increase in (longer) growing season with increasing preseason photoperiod at the start of vegetation growing season (i.e., synchrony), b Croplands in the south western region showing increase in (shorter) growing season with decreasing preseason photoperiod at the start of vegetation growing season (i.e., asynchrony). EVI time-series is represented by blue curves while photoperiod is represented by red curves. Vertical dashed black lines show LSP parameters (SOS and End of Season; EOS)

