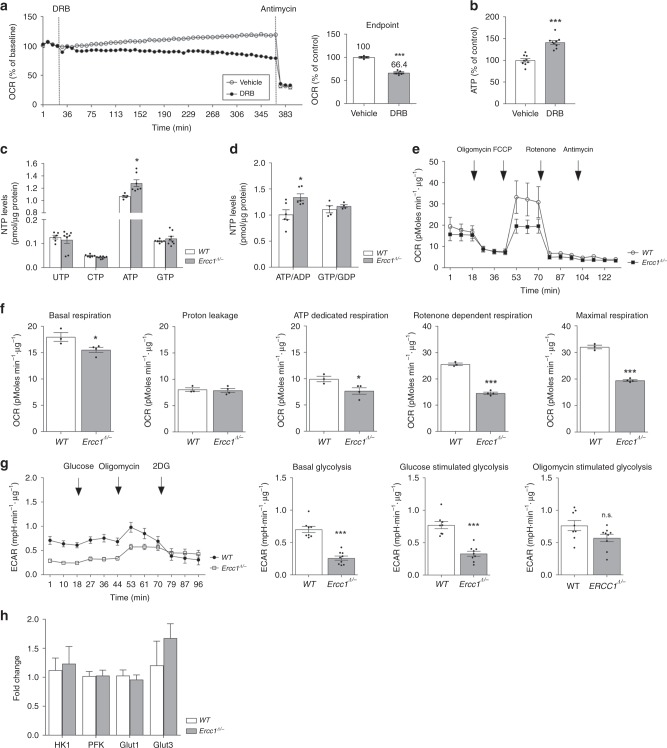
Fig. 2.
Diminished transcription leads to increased intracellular ATP levels. a Mitochondrial respiration–measured in real time as oxygen consumption rate (OCR)–is reduced in hepatocytes after the injection of the chemical transcription inhibitor DRB, thus indicating the bioenergetics burden of macromolecular synthesis (left trace). After 6 h of DRB treatment, transcription is reduced to 66.4% of its original level (right panel). b 6-h incubation with DRB leads to increased intracellular ATP levels, which confirm the bioenergetics burden of transcription; n ≥ 4, data were collected from 2 independent technical experiments. c, d HPLC analysis indicates that defective NER in Ercc1Δ/− (16 weeks) is associated with increased ATP levels and ATP/ADP ratio in vivo (16 week-old animals); n ≥ 4, data were obtained from 2 independent technical experiments. e, f Measure of respiration in primary hepatocytes shows that increased ATP levels in Ercc1Δ/− are not the consequence of augmented mitochondrial respiration. OCR was measured in freshly extracted hepatocytes in basal conditions and after sequential injections of the following molecules modulating mitochondrial activity: oligomycin, FCCP, rotenone and antimycin-A (see methods for details). Basal mitochondrial respiration and proton leakage are unaltered, while ATP-dedicated respiration, maximum respiratory capacity and rotenone-sensitive respiration are decreased in mutants. Cells were extracted from n ≥ 3 mice per group, data were collected from 2 independent technical replicates. g Increased ATP levels in Ercc1Δ/− are associated with glycolysis inhibition. Basal- and glucose-stimulated glycolysis, measured as extracellular acidification rate (ECAR), is decreased in Ercc1Δ/− mutants; oligomycin-stimulated glycolytic capacity, however, is retained and comparable to WT. Left, Seahorse Extracellular Flux Analyzer trace; right, bar graph of basal and glucose- and oligomycin-stimulated ECAR. Cells were extracted from n = 3 16-week old mice, 3 technical replicates. h Quantitative PCR indicates that the observed effects do not depend on expression changes in rate-limiting glycolytic enzymes or in glucose transporters (n ≥ 4 mice per group, 16 weeks). Error bars indicate mean ± s.e.m. *p < 0.05, **p < 0.01, ***p < 0.001; Student t-test. Original data are provided as a Source Data file

