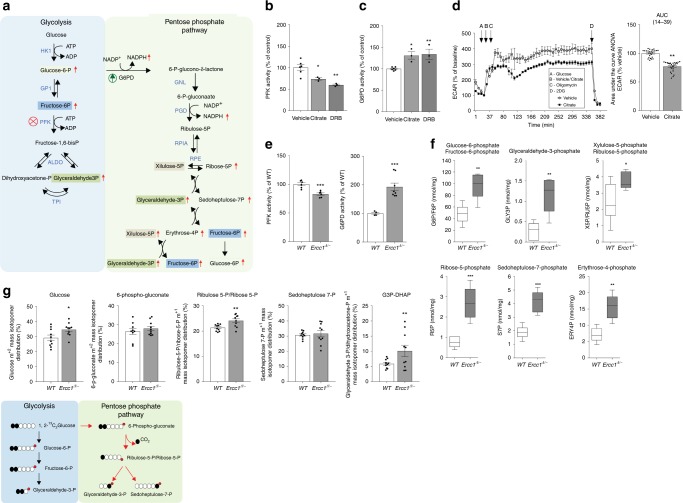
Fig. 3.
Potentiation of the pentose phosphate pathway (PPP) in Ercc1Δ/− mice. a Schematic of the glycolysis and PPP interconnected pathways. Some sugar phosphates are generated in both pathways and are highlighted by same color boxes (description of abbreviations in Supplementary table 6). Enzymes’ names are in blue font. Red arrows indicate molecules that were increased in Ercc1Δ/− liver extracts. b, c The PFK inhibitor citrate and the transcription inhibitor DRB down-regulate PFK enzymatic activity–the glycolysis rate limiting step–and potentiate the G6PD activity in primary fibroblasts. n ≥ 3, data were collected from three independent experiments. d The PFK inhibitor citrate induces reduction in the glycolytic flux, measured as ECAR in extracellular flux analysis (left trace). Treatment with citrate for 6 h is sufficient to reduce glycolysis to 77.2% of its original value (right graph). n ≥ 4; data were collected from two independent experiments. e PFK and G6PD enzymatic activities are respectively significantly reduced and increased in 16-week old Ercc1Δ/− mice (n ≥ 4 per group). f Sugar-phosphate quantitative metabolomics indicates an increase in vivo of several metabolites involved in the PPP. Box and whiskers represents data from n ≥ 4 16 weeks old mice per group. g Metabolic tracing experiments indicate augmented flux of carbohydrates through the PPP. Cells were incubated with [1,213C2]Glucose (2 mM) for 6 h prior to HPLC-coupled mass spectrometry analysis. The schematic (bottom panel) illustrates how the different measurable isotopes are generated from [1,213C2]Glucose; the red dot represents the phosphate group. n = 10 independent biological replicates extracted from n = 3 mice per group. Error bars indicate mean ± s.e.m. *p < 0.05, **p < 0.01, ***p < 0.001; one way ANOVA followed by Dunnet’s test in b, c or Student’s t-test in e–g. Original data are provided as a Source Data file

