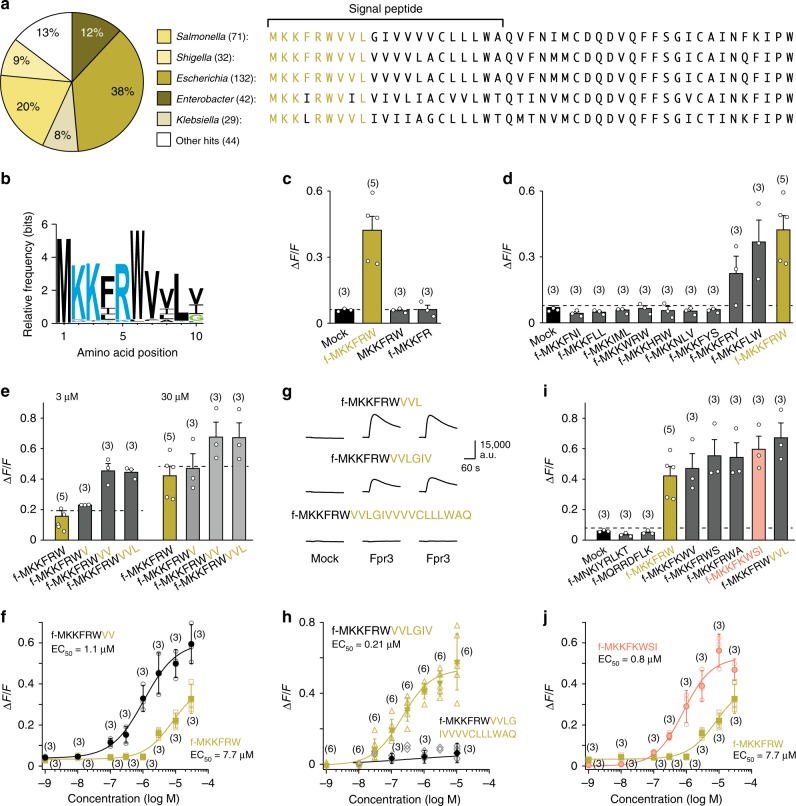
Fig. 2.
Fpr3 detects fMet peptides from the conserved MgrB signal sequence. a Distribution of mgrB in Enterobacteriaceae and amino acid (aa) sequences (one-letter code) of typical MgrB proteins. b Sequence logo displays the degree of aa conservation through letter size in the first 10 N-terminal residues of MgrB obtained from all 350 UniProt entries. c–j Mean Ca2+ responses of Fpr3-transfected HEK293T cells after exposure to fMet peptides structurally related to f-MKKFRW. c Fpr3 recognises the core agonist f-MKKFRW but not two truncated variants (30 µM each) that lack either the N-terminal formyl group (f-) or the C-terminal tryptophan (W). d Selectivity of Fpr3 to a panel of nine bacterial signal peptide fragments (30 µM each) with high sequence similarity to f-MKKFRW. e Effect of sequence elongation measured at 3 or 30 µM, respectively. Note that Ca2+ responses increased with longer peptides. f Concentration-response curves to stimulation with the core motif (gold metallic) or an elongated octapeptide (black). The EC50 value shifted to the left with the elongated sequence. g Fpr3 recognises N-terminal MgrB variants with 9 and 12 aa residues, respectively, but not a 21-residue variant. Shown are repeated Ca2+ responses of HEK293T cells transfected with an empty vector (mock) or Fpr3 after stimulation with MgrB peptides of 9, 12 and 21 residues (10 µM each). h Concentration-response curves to stimulation with a 12-mer (gold metallic) or 21-mer peptide (black). No signals were obtained for the 21-mer peptide. i Selectivity of Fpr3 to an additional panel of seven bacterial signal peptide fragments (30 µM each). Five of these display high sequence similarity to f-MKKFRW. Note that f-MKKFKWSI (salmon) found in some EsaA signal peptides produced similar response amplitudes as the elongated MgrB sequence. j Dose-response curve and EC50 value for stimulation with f-MKKFKWSI (salmon). c–f, h–j Numbers in parentheses indicate the number of independent experiments. Dashed line denotes the negative control signal obtained from mock application of assay buffer. Error bars, s.d. Source data are provided as a Source Data file

