Fig. 4.
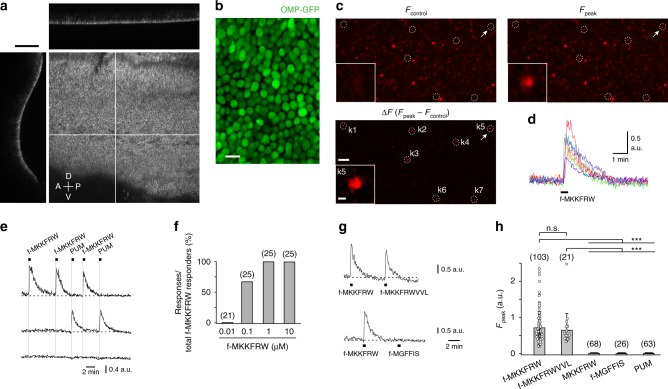
MgrB peptides are detected by native mouse VSNs. a Confocal image of an en face view of the VNE surface of a Trpc2-IRES-taumCherry mouse showing intrinsic mCherry fluorescence of VSN dendritic knobs. Orthogonal confocal section (top: xz or left: yz) demonstrates the crescent shape of the VNE surface. White lines indicate the position of the two orthogonal sections. Scale bar, 100 µm. A, anterior; P, posterior; D, dorsal; V, ventral. b High-resolution en face view on the VNE of an OMP-GFP mouse reveals tight packaging of VSN knobs expressing intrinsic GFP fluorescence from the Omp locus. c En face VNE confocal Ca2+ images of an adult B6 mouse showing Rhod-2 fluorescence at rest (Fcontrol), at the peak of the response (Fpeak) after stimulation with f-MKKFRW (1 µM), and as a ∆F image indicating responsive knobs. Inset, magnification of knob k5 (arrow). Scale bar, 20 µm; inset scale bar, 1 µm. d Time courses of f-MKKFRW-evoked Ca2+ transients from the seven knobs (k1-k7) shown in c. e (Top trace) Example of a Ca2+ response to f-MKKFRW that could be repeated multiple times. Note that PUM exposure failed to elicit a Ca2+ response in this knob. (Middle trace) Example of a knob that responded to PUM but not to f-MKKFRW. (Bottom trace) Example of a knob that responded to neither of the two stimuli. f The detection threshold for f-MKKFRW-evoked Ca2+ responses in VSNs of adult B6 mice was ≤0.1 µM. g, h Examples (g) and group data (h) showing the discriminative properties of f-MKKFRW-responsive VSN knobs to four different peptides and PUM stimulation. Data from individual knobs are plotted as open circles. Data in mean ± s.d. (N): f-MKKFRW, 0.71 ± 0.44 (103); f-MKKFRWVVL, 0.64 ± 0.45 (21); MKKFRW, 0.00 ± 0.00 (68); f-MGFFIS, 0.00 ± 0.00 (26); PUM, 0.00 ± 0.00 (63). Kruskal–Wallis ANOVA: χ2 (5) = 264.49; P < 0.0001; Mann–Whitney ***P < 0.001, ns, P = 0.39. Source data are provided as a Source Data file

