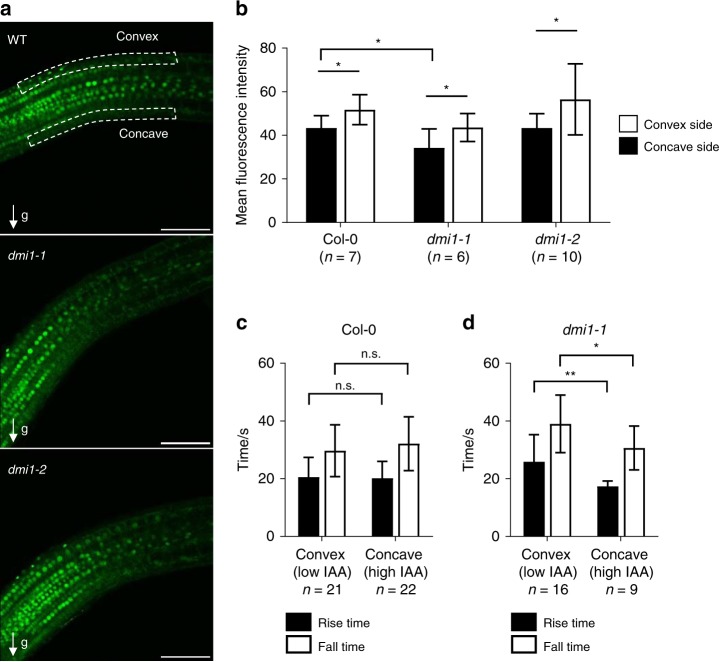
Fig. 4.
Analyses of auxin abundance and calcium spikes in the concave and convex side of bent roots. a Representative images of bent roots of Col-0, dmi1-1, and dmi1-2 plants expressing DII-VENUS 6 days after germination and 90 min after a gravity stimulus (g) of 90 degrees. Dashed lines delimit area used for quantification in the concave (high auxin) and convex (low auxin) sides. Scale bars represent 100 µm. b Mean fluorescence intensity of the DII-VENUS signals in Col-0, dmi1-1, and dmi1-2. Intensity was averaged across the concave and convex delimited areas (marked in a). The total area was the same for each plant. Values are means ± s.d. The number of plants imaged (sample size) is indicated (n). c, d Rise and fall time in seconds (s) of calcium spikes recorded in the convex (low auxin) and concave (high auxin) areas in wild-type (c) and dmi1-1 (d) roots. Values are means ± s.d. Sample size is indicated (number of spikes, n). n.s. not significant, *p < 0.05, **p < 0.01 (two-tailed t test with a prior F-test for homoscedasticity). The data represent two biological replicates

