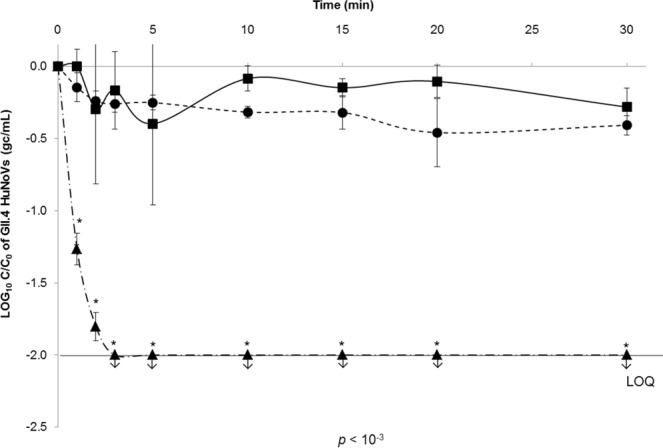
Figure 6.

Decay of GII.4 HuNoV binding to OLe+ saliva after exposure to heat treatments under high ionic strength condition (150 mM PBS). Squares (▪, solid line), circles (•, dotted line), and triangles (▲, dot-and-dash line) represent purified GII.4 HuNoV binding to untreated OLe+ human saliva after heating at 50 °C, 60 °C, and 72 °C for 30 min, respectively. The log (C/C0) values were calculated by dividing the mean GII.4 HuNoV gc/mL values obtained by HBGA-binding assays followed by RNA amplification by RT-qPCR at each time point (Ct) by the mean GII.4 HuNoV gc/mL values obtained at time 0 (C0). Each data point is an average of three replicates and error bars indicate standard deviations. Arrows (↓) represent data below the LOQ but above the LOD. The LOD and LOQ were 200 and 1,000 gc/mL of purified GII.4 HuNoVs, respectively. Paired Student’s t-test was used to compare groups.
