Fig. 1.
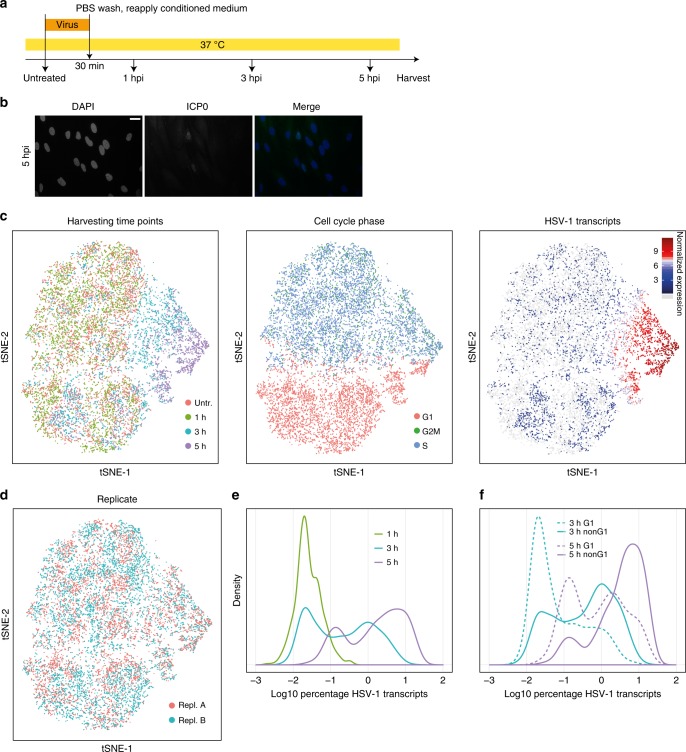
Single-cell RNA-sequencing of HSV-1-infected primary human fibroblasts shows cell cycle dependency. a Infection protocol. In parallel to single-cell RNA-sequencing, cells were harvested for bulk mRNA-sequencing and ICP0 immunofluorescence staining. b ICP0 immunofluorescence staining at 5 hpi. Scale bar: 20 µm. c Global display of scRNA-seq data as tSNE maps. Cells were colored by, from left to right, harvesting time points, cell cycle phase, and the normalized values of the sum of HSV-1 transcripts as a marker for the progression of infection. Cells without HSV-1 transcripts are in light gray. d tSNE maps with cells colored by replicate. e Relative densities of the percentage of viral transcripts (log 10 transformed) per cell for the three time points post infection. f Relative densities of the percentage of viral transcripts per cell (log 10 transformed) for G1 and non-G1 cells for cells harvested at 3 and 5 hpi

