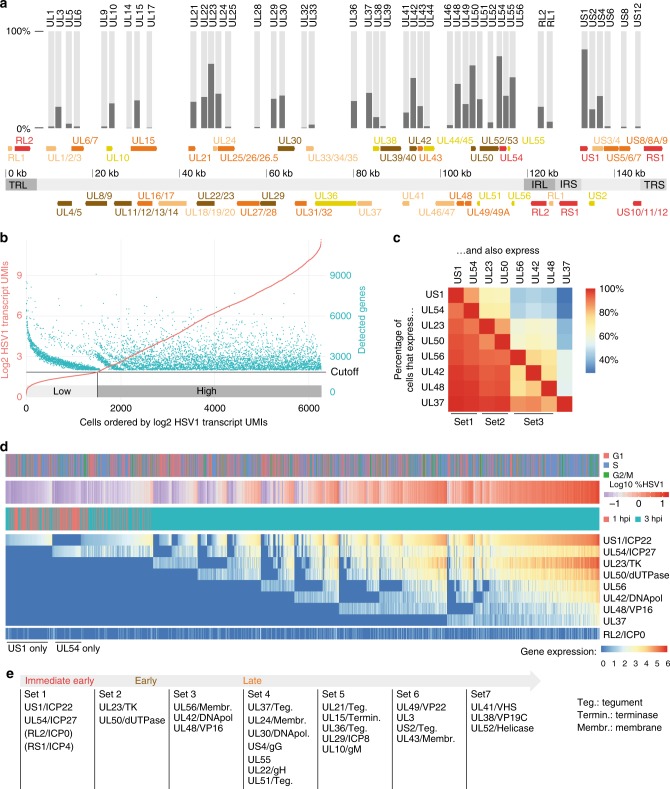
Fig. 2.
Onset of viral gene expression shows a set-wise emergence of viral transcripts. a Arrangement of viral genes on the HSV-1 genome. Immediate early genes were shown in red, early genes in brown, and late genes (gamma) in orange, γ1 in light brown, and γ2 in dark yellow. Genome segments were shown as light gray (unique regions) and dark gray areas (IRL, IRS: large/small internal repeats; TRL, TRS: large/small terminal repeats). Overlapping genes were merged. The bar plot on top shows in which percentage of “HSV-1 high” cells (see b for definition) the respective gene was detected. b Relationship between normalized levels of HSV-1 transcripts and the number of detected genes (human and viral) shows two categories of cells. Cells with at least one viral transcript were sorted by normalized HSV-1 transcript UMIs. Each cell is repesented by a red dot (log(2)-transformed sum of HSV-1 transcript UMIs, left axis) and a green dot (number of genes detected, right axis). Note that only cells with more than 2000 detected genes were used. The horizontal black line denotes the cutoff between high and low. For subsequent analysis, only the 3896 “high HSV-1” cells were used, in order to reduce the sampling error caused by the detection rate. c Percentages indicating co-occurrences of genes. Read as following, for example: 85% of cells that have US1 also have UL54 (top row, second field from left, dark orange) but only 29% have UL37 (top row, last field, dark blue), whereas 99% of cells that have UL37 also have US1 (bottom row, first field from left, red). d Heatmap of expression values of the first eight expressed viral genes in “HSV-1 high” cells, harvested at 1 and 3 hpi. Rows (genes) and columns (cells) were sorted as described in the main text. Above the heatmap, cell cycle, harvesting time point, and log 10-transformed percentage of viral transcripts. For the latter, blue colors indicate values in the first and second peak of the bimodal distribution from Fig. 1e, respectively. e Proposition for a refined scheme of temporal categorization of viral genes

