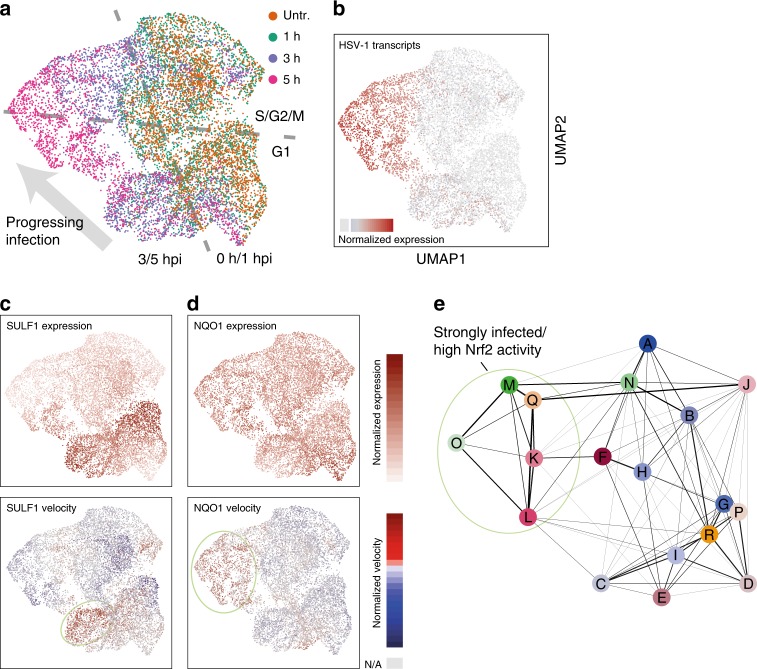
Fig. 5.
Subpopulations with common transcriptional activity defined by RNA velocity. a Cells were projected on a two-dimensional map using UMAP according to RNA velocity values, with cells colored by harvesting time point. Main distinguishing features were marked in gray. b Coloring by amount of HSV-1 transcripts. c and d Cells colored by expression values (top panels) and RNA velocity values (bottom panels) of the indicated genes. Color scales are shown to the right of these panels. For expression values, areas containing cells with relatively high expression levels were marked with a light green ellipse. For RNA velocity, cells for which no value could be calculated were colored in gray. e Groups of cells according to PAGA were labeled A to R. Transition probabilities between clusters are proportional to the line thickness between the clusters (right)

