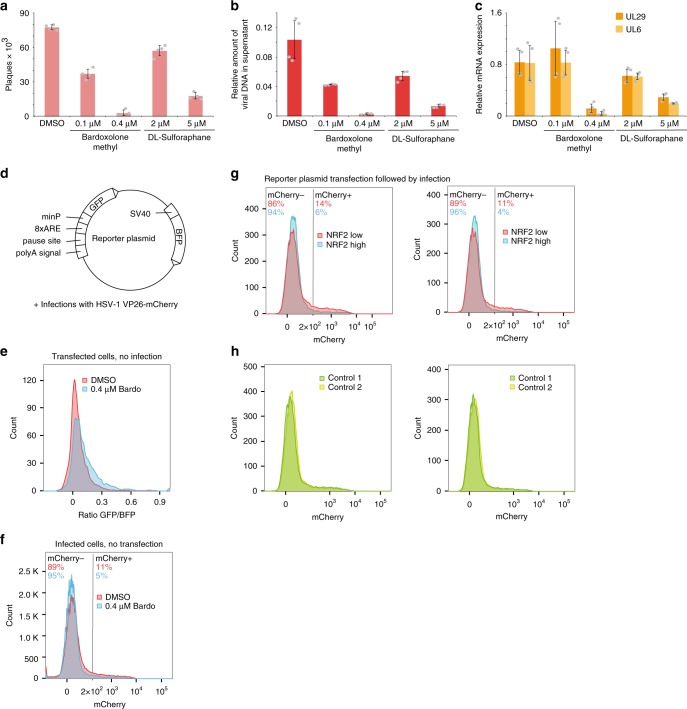
Fig. 6.
NRF2 activity counteracts HSV-1 infection. a–c NHDF cells were infected with HSV-1 at an MOI of 1. After removal of virus inoculum and washing with PBS, conditioned medium supplied with solvent or different concentrations of NRF2 agonists were added. At 16 hpi, virus production was assessed using plaque assays (a), by probing viral DNA in the supernatant using qPCR (b), and by measuring viral mRNAs in the RNA isolated from the cells using RT-qPCR (c). For all panels, bar plots indicate means, and error bars denote standard deviations; the individual measurement values (two each from n = 2 biologically independent samples) are shown as grey dots. Source data are provided in the Source Data file. d Design of the NRF2 reporter plasmid. SV40: simian virus 40 enhancer and promoter; BFP: blue fluorescent protein; polyA signal/pause site: polyadenylation signal and pause site for RNA polymerase II; 8×ARE: eight times antioxidant response element; minP: minimal promoter, GFP: green fluorescent proteins. e HEK 293 cells transfected with the reporter plasmid, and 24 h later treated with DMSO (red) or bardoxolone methyl (blue). Ratios of GFP to BFP signal were measured by FACS 15 h later and are displayed as overlapping histograms. f HEK 293 cells were infected with the HSV-1 VP26-mCherry virus at an MOI of 1. After removal of virus inoculum and washing with PBS, conditioned medium supplied with solvent or bardoxolone methyl was added. g HEK 293 cells were transfected with the reporter plasmid and 24 h later infected with the HSV-1 VP26-mCherry virus at an MOI of 1. At 16 hpi, intensities for BFP, GFP, and mCherry were measured by FACS and the distribution of the mCherry signal (which reflects progression of infection) in the NRF2 low and high populations plotted as histograms. Shown are two representative experiments. h as for g but with the distribution of the mCherry signal in the two control populations as defined in Supplementary Fig. 6f

