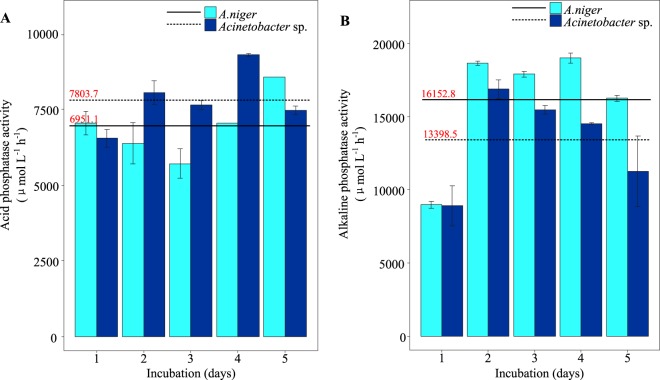
Figure 2.
Dynamic changes in acid phosphatase (A) and alkaline phosphatase (B) activity in lecithin-amended PVK medium inoculated with A. niger and Acinetobacter sp. during a 5-day incubation period. The X-axis represents the days of incubation, and the Y-axis represents the enzyme activity level (phosphatase activity expressed in μmol L −1 h−1). The solid lines represent the average enzyme activity of A. niger, and the dash lines represent the average enzyme activity of Acinetobacter sp.

