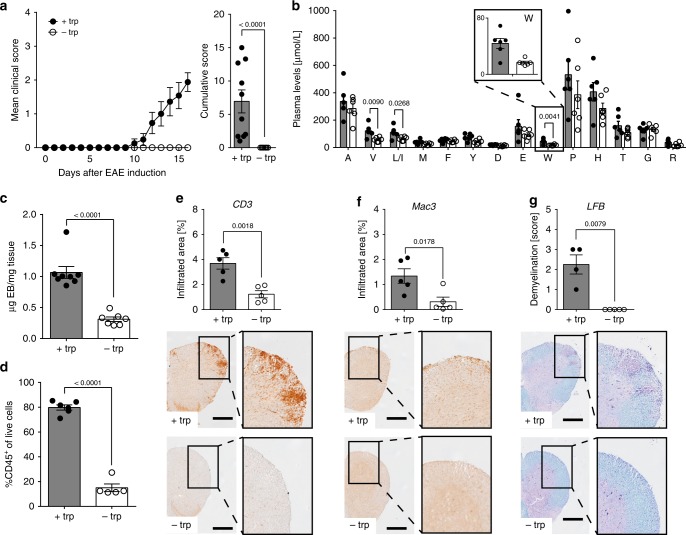
Fig. 2.
DTR inhibits EAE. a Mean clinical EAE scores and cumulative scores (+trp: n = 10; −trp, n = 10). b Plasma amino acid concentrations 16 days post-immunization (n = 6). c Blood–brain barrier (BBB) disruption in spinal cord as assessed by Evan’s Blue (EB) on d15 post-immunization (+trp: n = 8; −trp: n = 7). d Flow cytometric analysis of leukocyte infiltration into the spinal cord on d18 post-immunization (+trp: n = 5; −trp: n = 6). Displayed as CD45+ cells of live single cells. e–g Spinal cord sections of EAE mice were stained for e T cells (n = 5 vs. n = 5), f macrophages (n = 5 vs. n = 5), and g demyelination (n = 4 vs. n = 5). Scale bars: 250 μm. Statistics: Mann–Whitney U-test for a, g unpaired two-tailed Student’s t-test for b–f. Each dot represents one individual mouse. Data are presented as mean ± SEM. Source data are provided as a Source Data file

