
Figure 7.
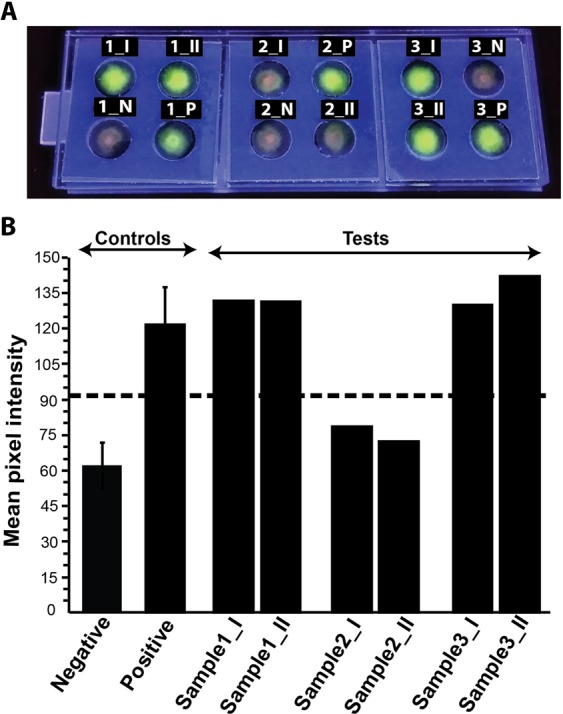
TB testing for clinical samples in FLIPP-NAAT. (A) Three clinical samples were tested per device with a negative and positive control in each module. Each sample was run in duplicates. Numbers on top of each zone represent the sample number and suffix ‘I’ and ‘II’ represent the duplicates. N – negative control and P – positive control. (B) Mean pixel intensity of green color from all the six blind clinical samples, negative and positive controls. The dashed line represents the threshold value of (µN + 3σN). Samples with intensity below the threshold were considered as TB negative while samples with green color intensity above the threshold were considered as TB positive.