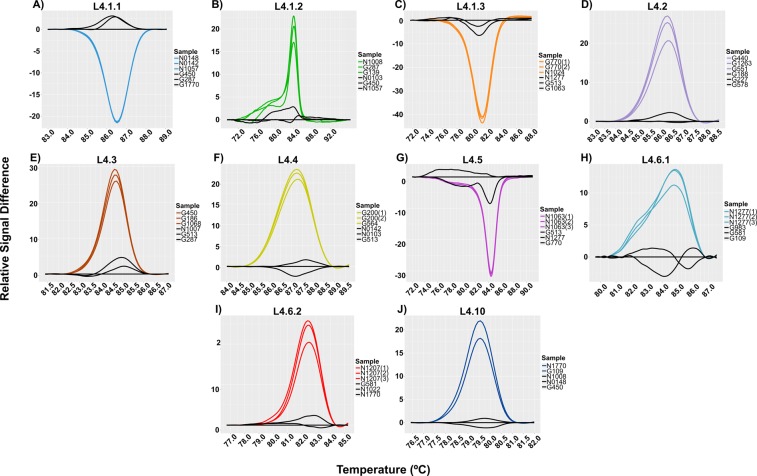
Figure 3.
Amplified melting curves for the detection of the MTBC L4 sub-lineages. The graphic shows the difference of the melting curves obtained by HRM analysis. Each letter represent a difference plot of every sub-lineage tested. (A) Sub-lineage L4.1.1. (B) Sub-lineage L4.1.2. (C) Sub-lineage L4.1.3. (D) Sub-lineage L4.2. (E) Sub-lineage L4.3. (F) Sub-lineage L4.4. (G) Sub-lineage L4.5. (H) Sub-lineage L4.6.1. (I) Sub-lineage L4.6.2 and (J). Sub-lineage L4.10. In all cases black lines indicate a wild type genotype.

