Figure 4.
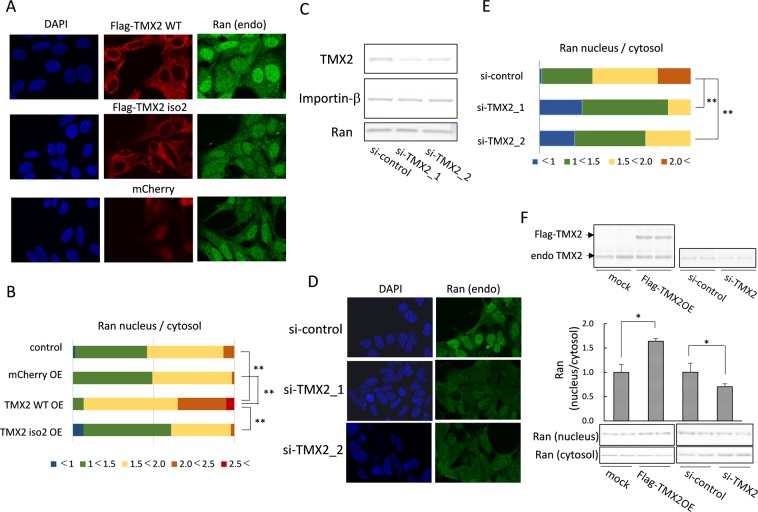
Regulation of the Ran protein gradient by TMX2. (A) Flag-TMX2 WT, Flag-isoform 2, or mCherry was overexpressed in HEK293 cells, and the distribution of endogenous Ran was analyzed by immunofluorescence microcopy. (B) The ratio of Ran levels in the nucleus/cytosol of each kind of cell (n = 60) was quantified. (C) si-RNA targeting for the negative control or TMX2 was lipofected into HEK293 cells, and TMX2, importin-β, or Ran protein levels were analyzed by western blotting. (D) Endogenous Ran distribution in TMX2 knockdown cells was analyzed by immunofluorescence microcopy. (E) The ratio of Ran levels in the nucleus/cytosol of each kind of cell (n = 60) was quantified. (F) The nuclear and cytosolic fractions of TMX2-overexpressing or -knockdown cells were extracted, and analyzed by western blotting with anti-Ran antibody. Values are the means ± S.D. for three experiments. The Ran nucleus/cytosol ratio of control cells (mock or si-control) was set at 1.0. *p < 0.05, **p < 0.01.

