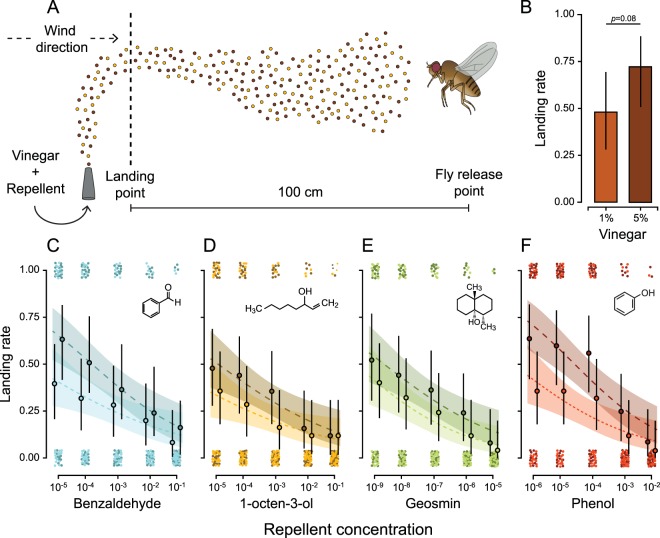
Figure 2.
A simplified representation of the wind tunnel assay (not to scale) is given in (A). In this example, an individual fly is exposed to an odour plume consisting of a mixture of vinegar (dark brown) and a repellent (yellow). (B) The landing rates on 1% and 5% vinegar by themselves. The landing rates on 1% vinegar (lights colours - finely dashed line) and 5% (dark colours - coarsely dashed line) in combination with (C) benzaldehyde, (D) 1-octen-3-ol, (E) geosmin and (F) phenol are given with their predicted linear regression lines based on a binomial GLM and their 95% confidence intervals. The actual landing rates on each combination of either 1% (light circles) or 5% (dark circles) vinegar with the repellents are presented with their 95% confidence intervals. The values of landing (1.00) or not landing (0.00) on the odour release point are jittered vertically and horizontally to visualize the binomial data.

