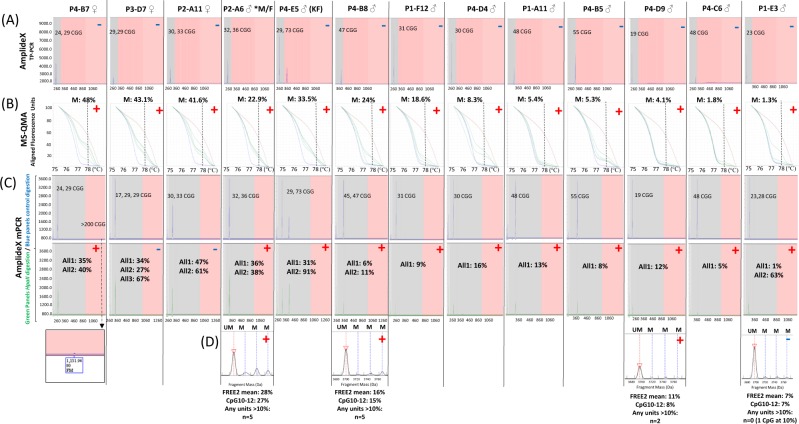
Figure 3.
Raw profiles, CGG sizes and methylation levels for thirteen cases with developmental delay identified to have abnormal methylation using MS-QMA, that were negative by 1st line testing using AmplideX triplet-repeat primed PCR (TP-PCR) commercial assay. For each panel + indicates a positive result; − indicates a negative result. AmplideX mPCR a positive result was defined as presence of: (i) abnormal methylation with or without FM in males (typically developing males have 0% methylation); (ii) presence of a FM in females. M = methylated peak. Each column indicates a different technique: (A) AmplideX TP-PCR; (B) MS-QMA; (C) AmplideX mPCR, with upper panels with blue traces representing control digestion and lower panels with green traces representing peaks from HpaII digestion reactions. These blue and green traces were used to determine average methylation across two HpaII sites, 5′ and 3′ of the CGG expansion using Gene Mapper software version 5.0 (Life Technologies, Foster City, CA), as per manufacturer’s instructions (Asuragen, Austin, Texas, USA). The raw profiles that include regions for visual assessment for the completeness of HpaII digestion controls have been included in the Fig. S1. (D) EpiTYPER system. Each column represents a different sample, with sample ID included in row 1. P4-B7; P3-D7 and P2-A11 were female referrals as indicated by ♀ in row 1, with abnormal MS-QMA signatures. The other cases were male referrals indicated by ♂ in row 1. Note: M methylation = mean HpaII methylation across detected alleles; *M/F = male that was biologically born as female; KF = Klinefelter syndrome. The vertical line superimposed onto MS-QMA profiles indicates the melt temperature of 78 °C used to differentiate between 100% and 0% methylated alleles, as previously described9; brown and blue melt curves represent FM and normal CGG size (<44 repeats) control samples, 100% and 0% methylated respectively. While green melt curves represent high resolution melt profiles used to determine % methylation by MS-QMA for the test samples, with 4 melt curve per sample representing two separate bisulfite conversion technical replicates, with each conversion having two melt curves from two serial dilutions, used to calculate % methylation by the Q-MAX software, as previously described10. All1 and All2 represent smaller and larger size alleles respectively. For sample P4-B7 of a female with developmental delay an unmethylated FM allele was detected by AmplideX mPCR but not by standard AmplideX TP-PCR. For the EpiTYPER system red triangles and red dotted lines represent mean peak height of the unmethylated fragment for FREE2 CpG10, 11 and 12 with positive calles based on methylation data presented for: (I) mean values across the 12 CpG sites; (II) CpG10–12 unit (previously shown to have the most significant correlation with intellectual functioning of all sites examined)17; (III) the number of CpG sites that had methylation above 10% maximum value of the control population examined in previous studies17. Note: pink background for panels in (A) represents peaks for alleles of PM CGG size and above (>54 CGGs); while for panels in (C) represent peaks for alleles of FM CGG size and above (>199 CGGs). Gray background represents peaks for alleles of <55 and <200 CGGs, for panels in (A) and (C) respectively.

