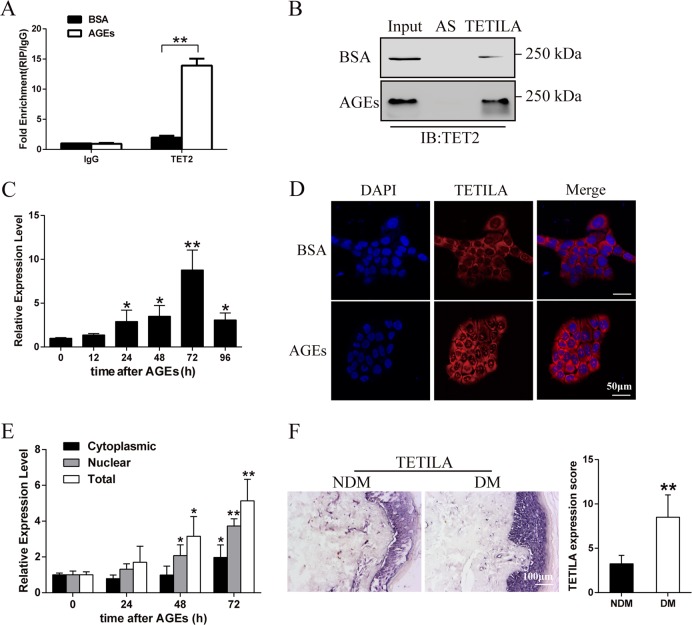
Fig. 1. Characterization of TETILA expression.
a Relative RIP assays using qPCR to detect binding between TETILA and TET2 in BSA- and AGEs-treated HaCaT cells (P = 0.000). b RNA pull-down showing the interaction between TETILA and TET2 in BSA- and AGEs-treated HaCaT cells. c TETILA expression kinetics in HaCaT cells following AGEs stimulation. d Confocal FISH images showing nuclear and cytoplasmic localization of TETILA in HaCaT cells. e TETILA expression measured by RT-qPCR in nuclear and cytoplasmic fractionations under BSA or AGEs treatment. f The expression of TETILA in foot skin from diabetic patients as measured by ISH (P = 0.008). The histograms indicate the quantitative analysis of TETILA expression in patients skin tissues. All PCR data were normalized to ACTB expression and represented as mean ± SD from three independent experiments. *P < 0.05, **P < 0.01 vs. the corresponding control group

