Figure 5.
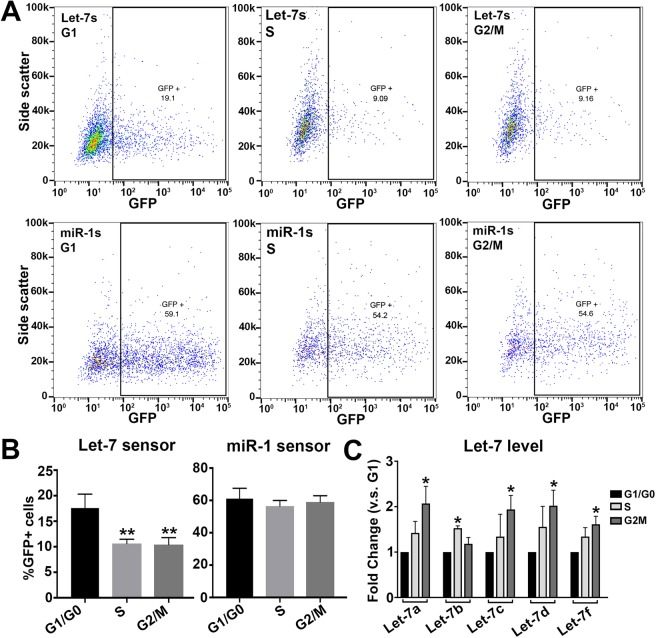
Let-7 activity and levels are highest when cells are in G2/M. (A,B) miRNA activity in untreated HER10 cells segregated by cell cycle phase using flow cytometry. (A) Representative examples of flow cytometry data quantifying the number of GFP+ cells in let-7s-transfected (top panels) or miR-1s-transfected (bottom panels) HER10 cells. The percentage of GFP+ cells in let-7s transfected samples is higher in G1 (black box, upper left panel) as compared to S and G2/M (black boxes, upper middle and right panels). However, the percentage of GFP+ cells in miR-1s transfected samples is similar in all phases of the cell cycle (bottom panels). (B) Quantification of flow cytometry data shown in (A). N = 3 experiments; 40,000 events per experiment. p = 0.0063 and p = 0.0055 for Let-7s S and G2M (v.s. G1) respectively. (C) qRT-PCR analysis of let-7a,b,c,d,f in G1, S, and G2/M phase populations segregated using FACS with ClickIt-EdU and DAPI. With the exception of Let-7b, which is highest in S-phase, all let-7 family members are highest in the G2/M population. N = 3 experiments; with > 500k cells per population. p = 0.012 (let-7a G2M), p = 0.023 (let-7b S), p = 0.039 (let-7c G2M), p = 0.019 (let-7d G2M), and p = 0.039 (let-7f G2M).

