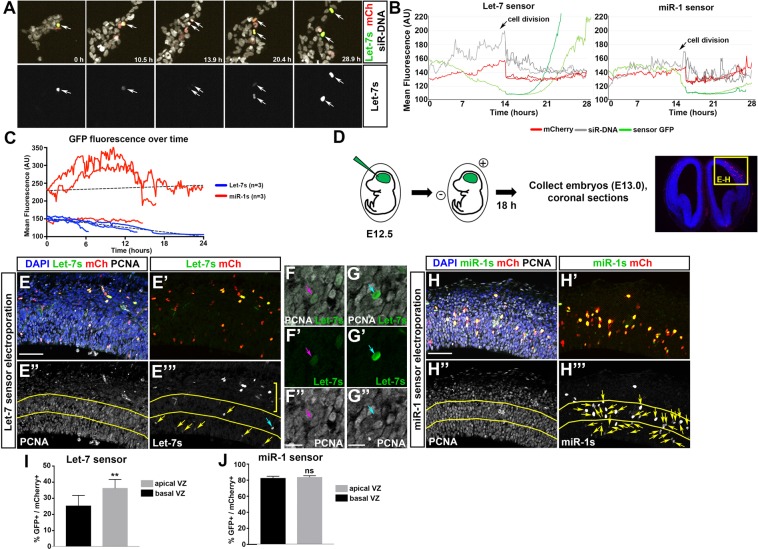
Figure 6.
Let-7 activity oscillates when cells progress through the cell cycle in vitro and in vivo. (A–C) Real-time assessment of let-7 activity using live imaging. (A) Time lapse imaging of HER10 cells transfected with let-7 sensor (green, top panel; white, bottom panel) and mCherry (red). DNA visualized using siR-DNA stain (white, top panel). Following one let-7 sensor GFP+ cell for 28 hours showed that GFP fluorescence is initially high, declines gradually prior to cell division, and increases again in the resulting daughter cells. (B) Quantification of let-7 sensor GFP, mCherry and siR-DNA fluorescence over time in the cell shown in A (left panel), with side-by-side comparison of a miR-1 sensor transfected cell (right panel). Unlike let-7 sensor transfected cells, GFP levels remain steady in miR-1 sensor transfected cells until chromosome condensation (which can be visualized by a rapid increase in siR-DNA fluorescence; arrows on graph), during which there is a rapid loss of GFP fluorescence. (C) Quantification of GFP fluorescence in three dividing cells in both let-7s (blue) and miR-1s (red) transfected cultures, prior to cell division. (D–J) Analysis of let-7 activity in the cortex in vivo using in utero electroporation. (D) Schematic describing in utero electroporation work-flow. (E) Coronal sections of in utero electroporated cortex immunostained for GFP (let-7s; green in E,E’ and white in E”’), mCherry (red in E,E’) and PCNA (white in E,E”). The VZ was located by staining for PCNA (yellow lines in E” and E”’). Many GFP+ cells were located in the basal region of the cortex, outside of the VZ (yellow bracket in E”’). There were more GFP+ cells (yellow arrows) in the apical half of the VZ (below the lower yellow line) when let-7s was electroporated. GFP+/PCNA- cells (blue arrow in E”’) were not counted. (F) Representative example of a let-7s GFP+ cell (green in F,F’) that is PCNA+ (white in F,F”). (G) Representative example of a let-7s GFP+ cell (green in G,G”) that is PCNA- (white in G,G”). (H) Coronal sections of in utero electroporated cortex immunostained for GFP (miR-1s; green in H,H’ and white in H”’), mCherry (red in H,H’) and PCNA (white in H,H”). The VZ was located by staining for PCNA (yellow lines in E” and E”’). There was no difference in the number of GFP+ cells (yellow arrows) located in the apical v.s. basal halves of the VZ when miR-1s was electroporated. (I) Quantification of the percentage of electroporated cells (mCherry+) that were GFP+ in the ventral or basal half of the VZ when let-7s was electroporated. N = 3 embryos, p = 0.0071. (J) Quantification of the percentage of electroporated cells (mCherry+) that were GFP+ in the ventral or basal half of the VZ when miR-1s was electroporated. N = 3 embryos. Scale bar in (E,H): 50 μm, scale bar in F and G: 10 μm.

