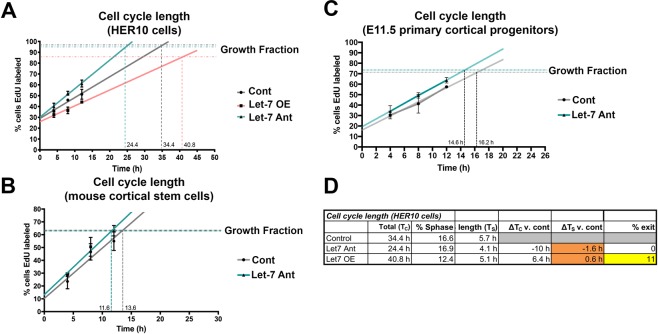
Figure 8.
Let-7 regulates cell cycle dynamics by altering the length of the progenitor cell cycle. Cumulative EdU labeling in HER10 cells (A), mCSCs (B) and E11.5 mouse cortex primary cultures (C), to assess the length of the progenitor cell cycle. (A) HER10 cells were transfected with mCherry alone (Cont; grey line), pLV-let-7 (Let-7 OE; orange line) or a let-7 antagomiR (Let-7 Ant; teal line). The percentage of EdU+ cells was visually quantified at 4-, 8-, 12-, 24- and 48-hour time points (after addition of EdU). n = 3 samples per condition. Growth fraction = the percent of EdU+ cells at the final time point. (B) Cumulative EdU labeling in mCSCs transfected with mCherry alone (Cont; grey line) or a let-7 antagomiR (Let-7 Ant; teal line). The percentage of EdU+ cells was visually quantified at 4-, 8-, 12-, and 24-hour time points (after addition of EdU) n = 3 samples per condition. (C) Cumulative EdU labeling in E11.5 mouse cortex primary cultures transfected with mCherry alone (Cont; grey line) or a let-7 antagomiR (Let-7 Ant; teal line). The percentage of EdU+ cells was visually quantified at 4-, 8-, 12-, and 24-hour time points (after addition of EdU. n = 3 samples per condition.) (D) Table comparing the total cell cycle length in HER10 cells from each condition (TC) and the percent of cells in S-phase from our flow cytometry analysis (see Fig. 7B). We used these observations to estimate the length of S-phase (TS). We predict that the length of S-phase changes with Let-7 OE and Let-7 Ant (∆TS), but that this does not explain the total changes in cell cycle length (∆TC). On average, in let-7 OE transfected cultures, 11% of cells exit the cell cycle.

