Figure 9.
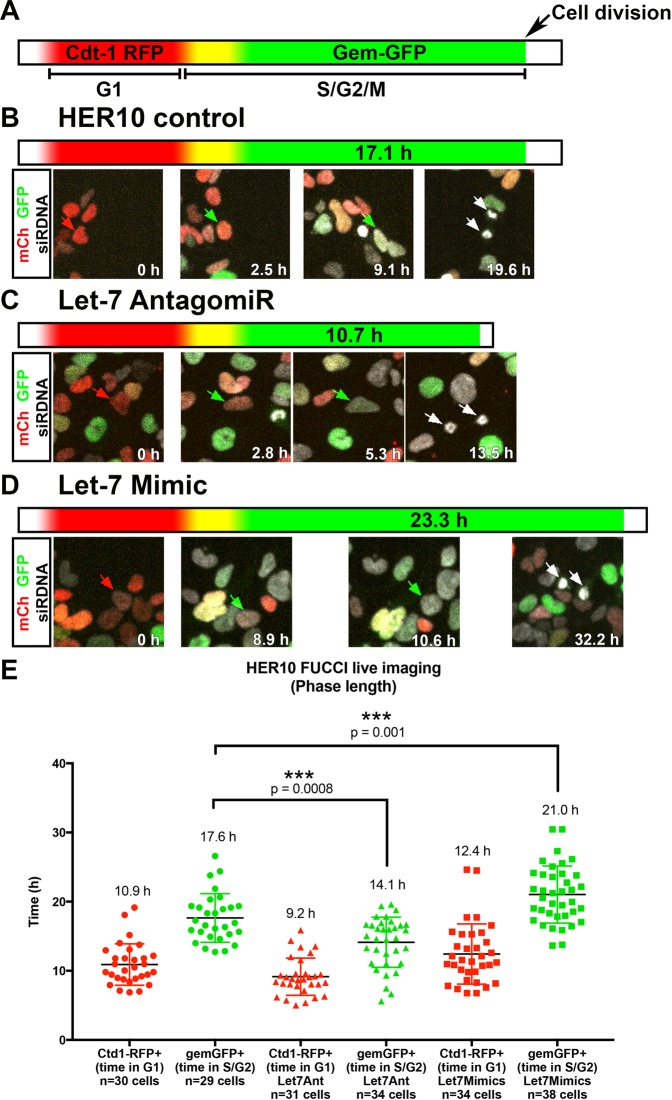
The length of S/G2/M is affected by let-7 overexpression and knockdown. Real-time assessment of cell cycle phase length by live-imaging using the fluorescent reporter FUCCI. (A) Schematic of the FUCCI reporter. Cells express Cdt-1 RFP (red) in G1. Upon entry into S-phase, cells begin to express Gem-GFP and are yellow for a short period before Cdt-1 RFP is degraded and the cells are green. (B) Representative example of a movie assessing the length of S/G2/M in control HER10-FUCCI cells. The cell being tracked (red arrow) is red at 0 h. After 2.5 h, Gem-GFP becomes detectable (green arrows). The cell remains green for 17.1 h before dividing into two daughter cells (white arrows; see Movie 3). (C) Representative example of a movie assessing the length of S/G2/M in let-7 Ant-transfected HER10-FUCCI cells. In this example, the Gem-GFP+ phase is only 10.7 h (green arrows) before the cell divides into two daughter cells (white arrows; see Movie 4). (D) Representative example of a movie assessing the length of S/G2/M in let-7 mimic transfected HER10-FUCCI cells. In this example, the Gem-GFP+ phase is extended to 23.3 h before the cell divides (white arrows; see Movie 5). (E) Quantification of all HER10-FUCCI live imaging. (n = 3 movies per condition, with approximately 30 cells tracked per phase (G1 or S/G2/M), per condition).

