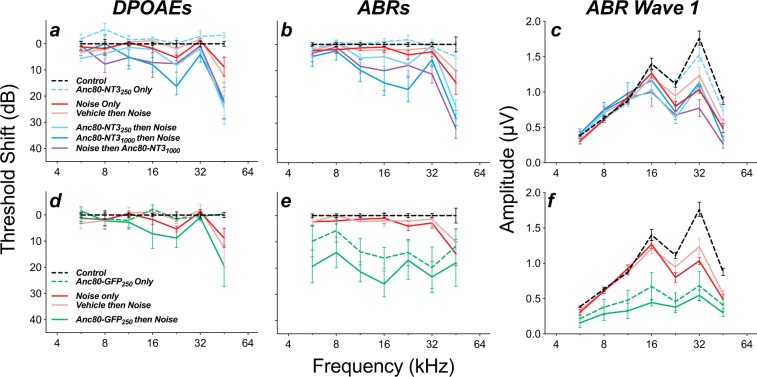
Figure 7.
NT3 overexpression slightly increased noise-induced threshold shift in both DPOAEs (a) and ABRs (b), with a concomitant reduction in wave 1 amplitudes (c). GFP overexpression similarly increased noise-induced DPOAE thresholds shifts (d), while greatly increasing ABR thresholds (e) and reducing ABR wave 1 amplitudes (f) with or without noise exposure. Groups and group sizes were as follows: Controls (n = 15), Noise Only (n = 10), Vehicle then Noise (n = 5), Anc80-NT3250 Only (n = 6), Anc80-NT3250 then Noise (n = 7), Anc80-NT31000 then Noise (n = 8) and Noise then Anc80-NT31000 (n = 5). Group sizes for the GFP groups were as follows: Anc80-GFP250 Only (n = 7), and Anc80-GFP250 then Noise (n = 5). Wave 1 amplitude is extracted from each case at each frequency by averaging results from stimulus levels of 60, 70, and 80 dB SPL. Means (±SEMs) are shown in all plots. All data are normalized to mean values in unexposed controls.

