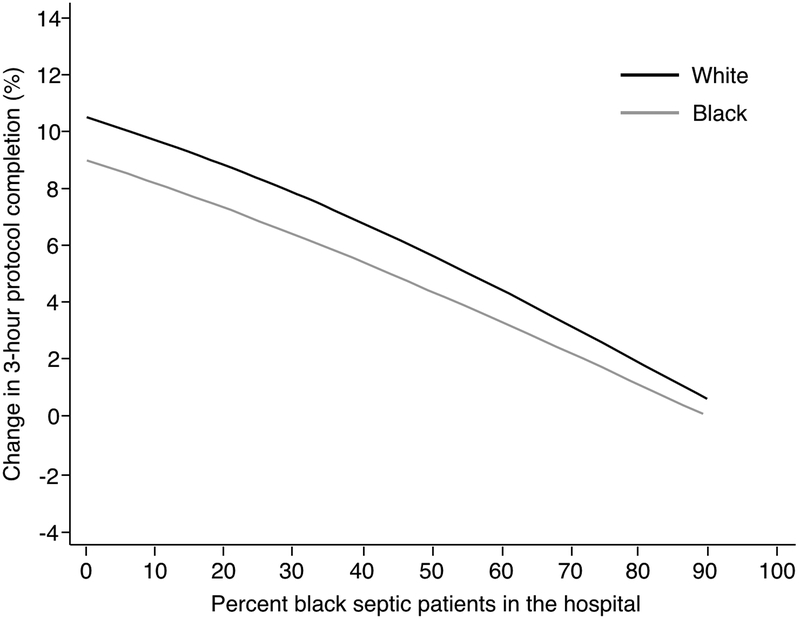
Exhibit 4. Figure. Improvement in adjusted 3-hour protocol completion for all emergency department patients stratified by the percent black septic patients in the hospital.
Authors’ analysis of data provided from the New York Sepsis Initiative. Notes: Analysis based upon a mixed effects logistic regression where the hospital’s percentage black population, calendar quarter, and their interaction are entered into the model as a linear continuous term (N=49,939). The white and the black populations are shown. Model adjusted for teaching hospital (dichotomized), non-profit hospital vs. other, NYC vs. metro vs. rural location, number of cases, and the number of certified hospital beds. The unit of analysis is the hospital. There is no statistical difference between the lines representing white and black patients. A figure displaying 95% confidence intervals is provided in the online supplement (Appendix Exhibit A13)17.

