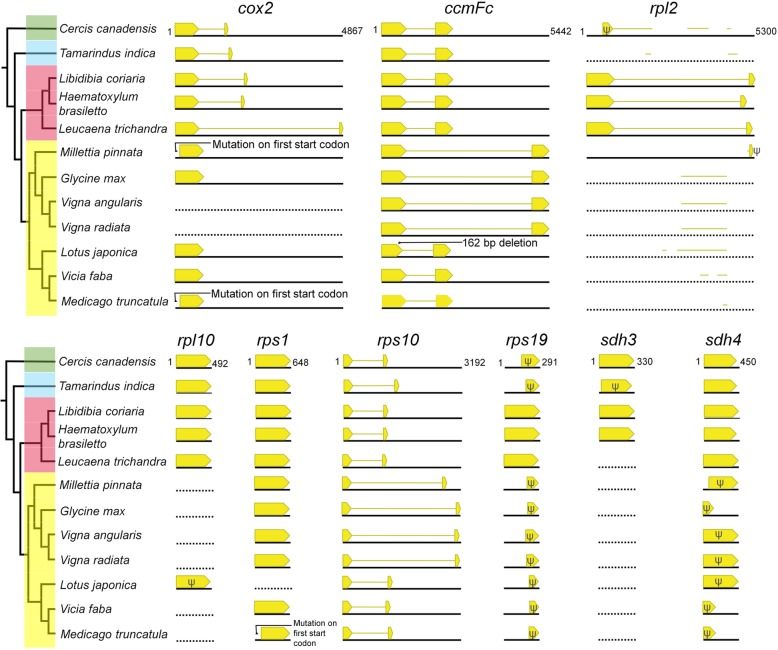
Fig. 4.
Highly variable mitochondrial genes in Fabaceae. Relationships among the taxa and corresponding subfamilies (green = Cercidoideae; blue = Detarioideae; red = Caesalpinioideae; yellow = Papilionoideae) are depicted in the cladogram on the left. The cladogram is drawn from the phylogenetic tree in Fig. 1. Yellow bars and lines indicate CDS and intron regions, respectively. Length of black line below each gene is based on longest copy of gene among the species, the value of which is given for Cercis. Genes without recognizable coding sequences are represented as dotted black lines. Putative pseudogenized or truncated genes are indicated with psi (Ψ). Sequence fragments (< 100 bp) are not presented. Position of sequence fragment was determined based on corresponding region of the longest gene. Intron and CDS length are proportional for the same gene but not between genes

