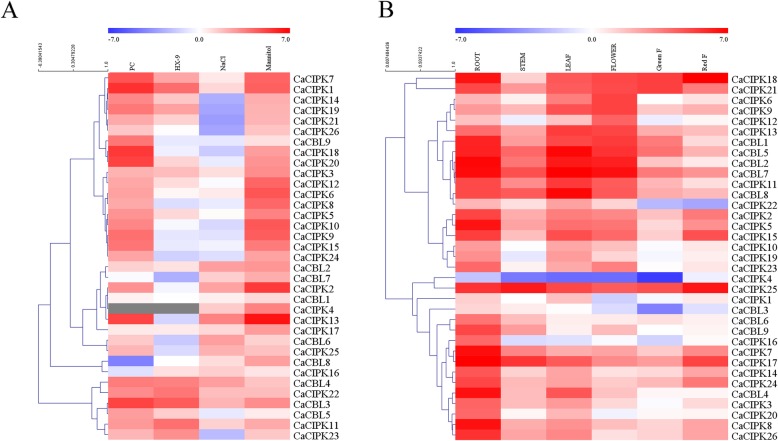
Fig. 5.
Expression patterns of CaCBLs and CaCIPKs in plants exposed to P. capsici, NaCl, and mannitol (a), and in different tissues (b). The grey means N/A. The samples in (a) were collected at different time points (6 hpt and 12 hpi for abiotic and biotic stresses respectively). “F” in (b) represents fruit. Actin (AY572427.1) is used as the internal control. Relative transcript levels were calculated using the comparative threshold (2−ΔΔCT) method, and normalized using log2. The heat map was created by MeV

