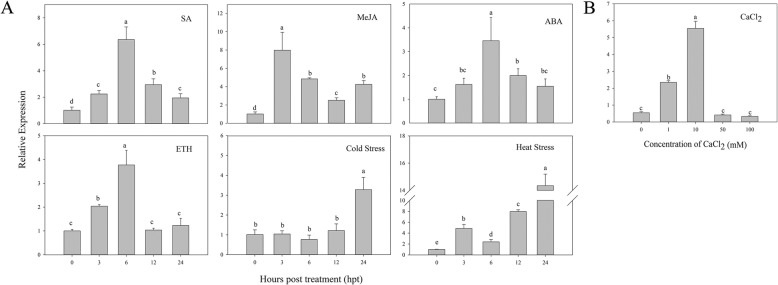
Fig. 6.
Expression patterns of CaCIPK1 in plants exposed to SA, MeJA, ABA, ETH, cold (4 °C) and heat (42 °C) stress (a), and different concentration of CaCl2 (b). The samples in (a) were collected at different time points (0, 3, 6, 12, 24 hpt), and in (b) were at 6 hpt. Actin (AY572427.1) is used as the internal control. The error bars indicate the standard error (SE) for three replicates are showed. Letters (a–d) represent significant differences (LSD, p < 0.05)

