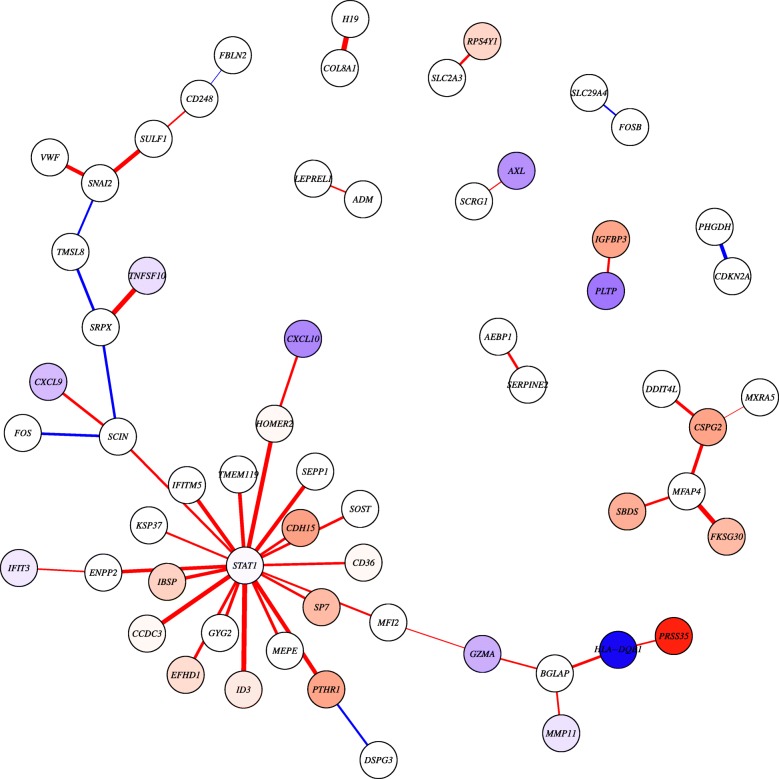
Fig. 1.
Significant differential network edges associated with osteosarcoma survival. Network visualization of the 50 edges with the most significant differences in their estimated correlation based on a LIMMA analysis comparing single sample edge weights between patients with poor and better MFS. Edges are colored based on whether they have higher weights in patients with poor (red) or better (blue) MFS. Thicker edges represent higher fold changes. Absolute edge fold changes range from [0.75,1.28]. Nodes (genes) are colored based on the t-statistic from a differential expression analysis. Nodes with absolute t-statistic <1.5 are shown in white, nodes in red/blue have higher expression in patients with poor/better MFS, respectively

