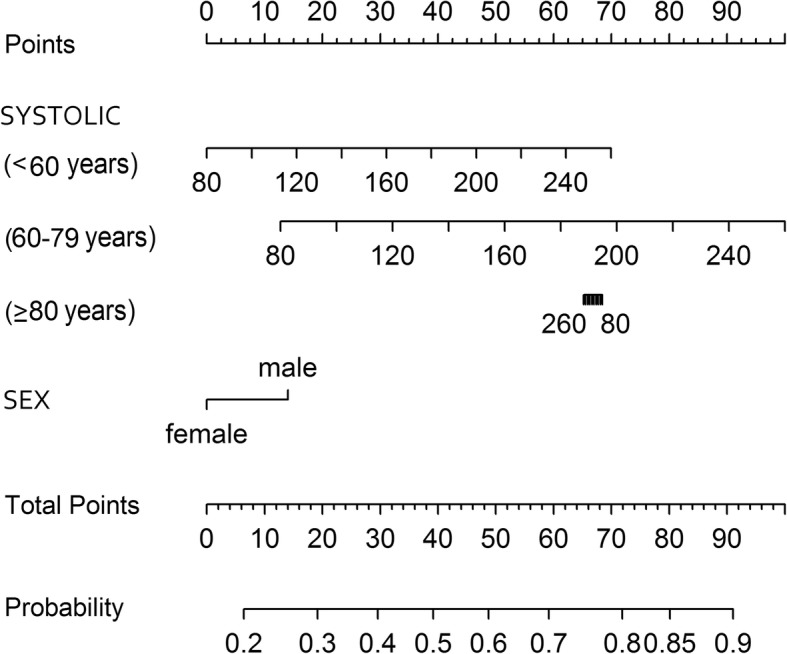
Fig. 3.

Nomogram for the reduced logistic regression model predicting TIA/minor stroke versus stroke-mimic with from sex and the interaction of age and systolic blood pressure. To use the nomogram for a patient with given SBP, age, and sex, use the ‘Points’ scale at the top of the figure to ascertain points for each variable aligning the scale vertically with the variable value. For example, for a male patient aged 50 with SBP of 120 mmHg, score 15 points for male and 15 points for age < 60 years with SBP of 120 mmHg. The ‘Total Points’ value is 30. Align the value of 30 on the ‘Total Points’ scale with the ‘Probability’ scale, to determine an approximate probability of TIA/MS of 0.40 for this patient. Note that the SBP points for patients older than 80 years decrease with increasing SBP as the SBP odds ratio for that group is less than one
