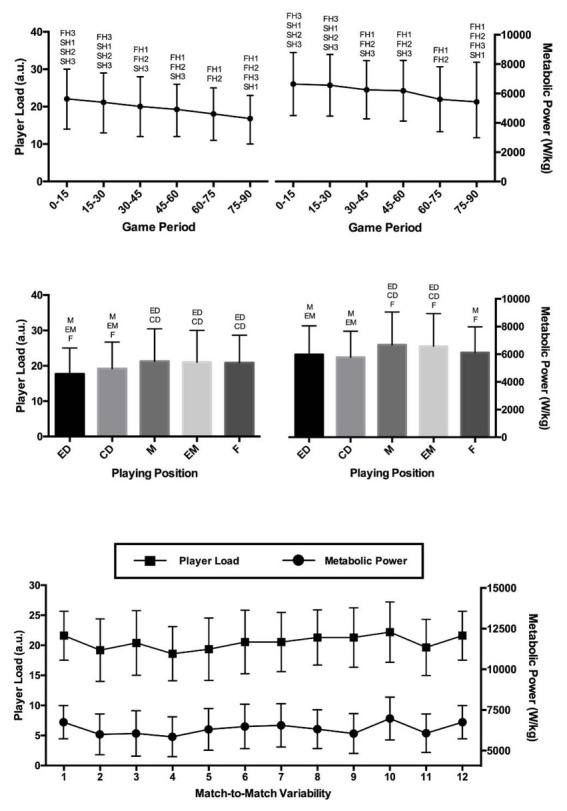
Figure 1.

Player Load and Metabolic Power dynamics according to the 15‐min game period, playing position and match‐to‐match variability. FH1Significant differences with first half 1 (p < .05), FH2Significant differences with first half 2 (p < .05), FH3Significant differences with first half 3 (p < .05), SH1Significant differences with second half 1 (p < .05), SH2Significant differences with second half 2 (p < .05), SH3Significant differences with second half 3 (p < .05),EDSignificant differences with the external defenders (p < .05), CDSignificant differences with the central defenders (p < .05), MSignificant differences with the midfielders (p < .05), EMSignificant differences with the external midfielders (p < .05), FSignificant differences with the forwards (p < .05).
