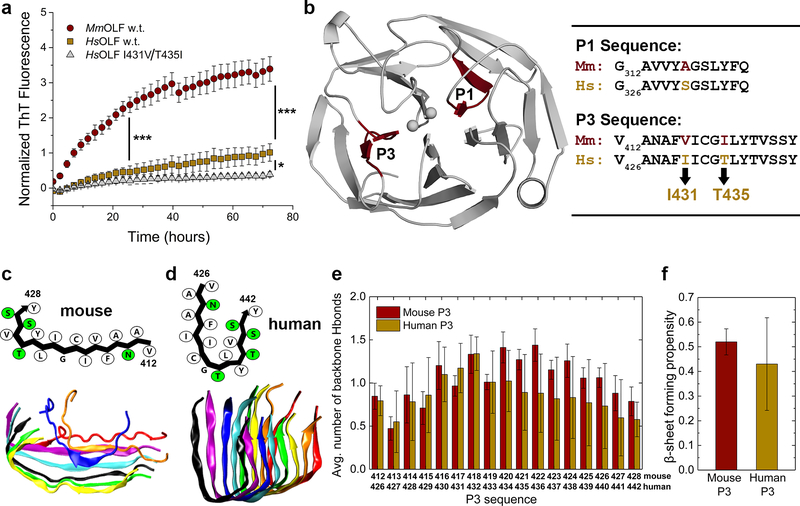
Figure 4.
MmOLF aggregation kinetics, and DMD/PRIME20 simulations of amyloidogenic mouse P3. (A) Aggregation of purified MmOLF, HsOLF and HsOLF variant I431V/T435I monitored by ThT fluorescence at 42 °C over 72 hours; * (p < 0.01) and *** (p < 0.0001) represent statistically significant differences relative to HsOLF at 24h and 72h. (B) Location of amyloidogenic stretches P1 and P3 within the OLF domain (left), and sequence alignment of mouse and human P1 and P3 (right). (C) Simulated L-shaped mouse P3 protofilament in schematic representation (above) with hydrophobic and polar residues indicated in white and green, respectively, and representative final simulation snapshot (below). (D) Simulated U-shaped conformation of human P3 protofilament in schematic representation (above) and representative final simulation snapshot (below). (E) Average number of interpeptide backbone hydrogen bonds (H-bonds) formed per residue and (F) average β-sheet propensities calculated for human and mouse P3 peptides. All error bars represent standard deviation.

