Fig. 5.
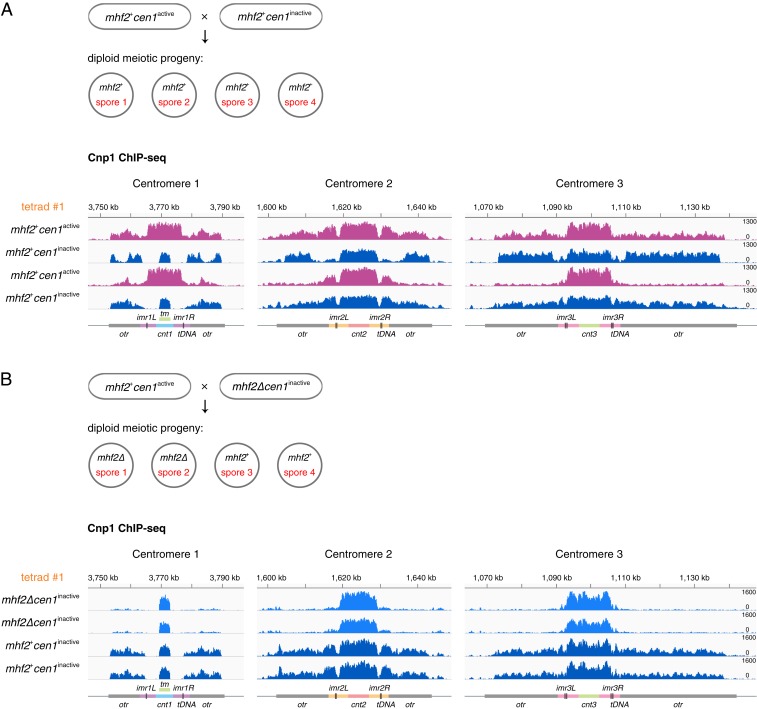
The endogenous centromere in mhf2+ cells tends to be converted to an inactivated centromere by mhf2∆ through meiosis. (A) Schematic illustrates the meiotic progeny of mhf2+cen1active × mhf2+cen1inactive in asci with 4 spores. Cnp1 ChIP-seq reads mapped to centromeric and pericentromeric regions of all 3 chromosomes in 4 viable meiotic progeny from the same ascus (tetrad #1) of mhf2+cen1active × mhf2+cen1inactive. mhf2+cen1inactive (dark blue) conformed to Mendelian inheritance (2: 2 segregation pattern). mhf2+cen1active (magenta) exhibits the spreading of Cnp1 into the pericentromeric regions. See SI Appendix, Fig. S7B for accompanying H3K9me2 ChIP-seq data. (B) Schematic illustrates the meiotic progeny of mhf2+cen1active × mhf2∆cen1inactive in asci with 4 spores. Same procedure as in A for analyzing mhf2+cen1active × mhf2∆cen1inactive. mhf2∆ conformed to Mendelian inheritance (2: 2 segregation pattern). cen1inactive was detected in mhf2+ (dark blue) and mhf2∆ (blue). See SI Appendix, Fig. S8B for accompanying H3K9me2 ChIP-seq data. Diagrams, x axis and y axis, same as in Fig. 1.

