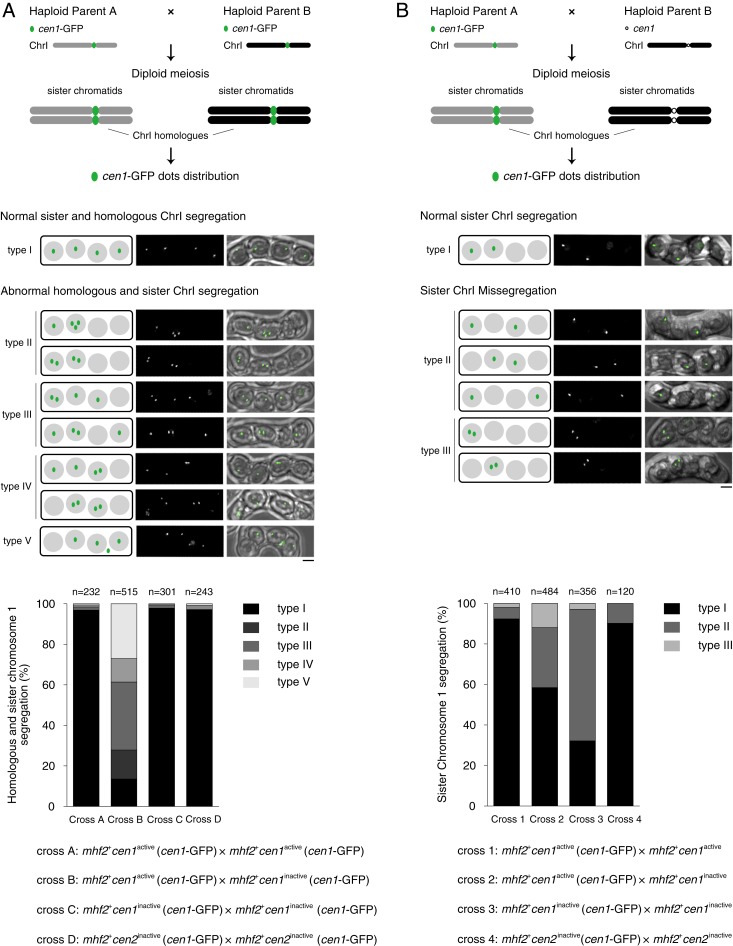
Fig. 6.
Homozygotic meiosis with matched neocentromeres exhibits premature segregation of sister chromatids. (A) Schematic illustrates the meiotic segregation of chromosome 1 (ChrI) in the genetic cross between haploid parent A (gray) and haploid parent B (black), both cells carrying the chromosome 1 marker—lys1 locus decorated with GFP (lys1::lacOs/lacI-GFP)—designated as cen1-GFP (green dot). The distributions of cen1-GFP are categorized into 5 types (type I to type V). (Scale bar, 2 μm.) Cross A-B, mhf2+cen1active cells crossed to mhf2+cen1active and mhf2+cen1inactive cells, respectively; cross C, mhf2+cen1inactive cells crossed to mhf2+cen1inactive cells; cross D, mhf2+cen2inactive cells crossed to mhf2+cen2inactive cells. The cen1-GFP dots were scored in 4-spored asci to trace the meiotic segregation of homologous chromosome 1 and sister chromosome 1. n, the total 4-spored asci analyzed. (B) Schematic illustrates the meiotic segregation of chromosome 1 (ChrI) in the genetic cross between haploid parent A (gray) carrying the cen1-GFP and haploid parent B (black). Black circle, centromere 1 without GFP labeling (cen1). The distributions of cen1-GFP are categorized into 3 types (type I to type III). (Scale bar, 2 μm.) Crosses 1 and 2, mhf2+cen1active cells crossed to mhf2+cen1active and mhf2+cen1inactive cells, respectively; cross 3, mhf2+cen1inactive cells crossed to mhf2+cen1inactive cells; cross 4, mhf2+cen2inactive cells crossed to mhf2+cen2inactive cells. The cen1-GFP dots were scored in 4-spored asci to trace the meiotic segregation of sister chromosome 1. n, the total 4-spored asci analyzed.

