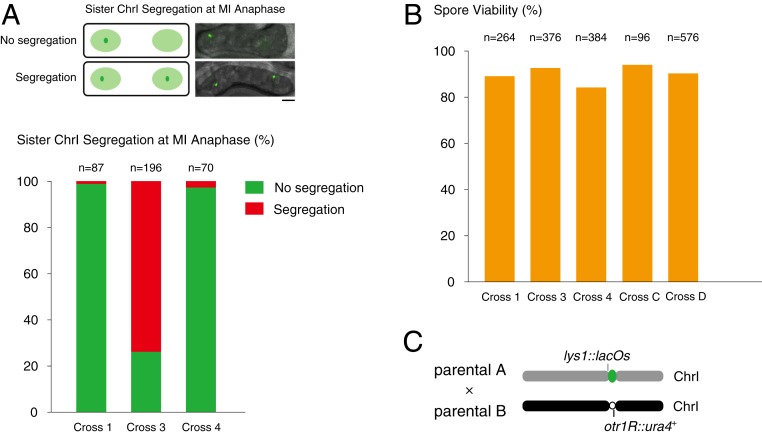
Fig. 7.
Homozygotic repositioned centromeres undergo meiotic segregation events in an inverted order and exhibit wild-type level spore viability. (A) Schematic illustrates the segregation pattern of sister chromosome 1 at anaphase during meiosis I (MI anaphase). (Scale bar, 2 μm.) The graph plots the percentage of MI anaphase cells displaying cosegregation (green) or presegregation (red) of sister chromosome 1 in homozygotic meiosis. n, The total counted MI anaphase cells. (B) Intact asci with 4 spores from the above genetic crosses were dissected microscopically and scored for the number of viable spores. Spore viability was calculated as the ratio of the number of viable spores to the number of analyzed spores. n, The total spores analyzed. (C) Schematic illustrates the assay calculating the crossover rates of regions nearby the centromere between parental A (lys1::lacOs/lacI-GFP) and parental B (otr1R::ura4).

