Fig. 1.
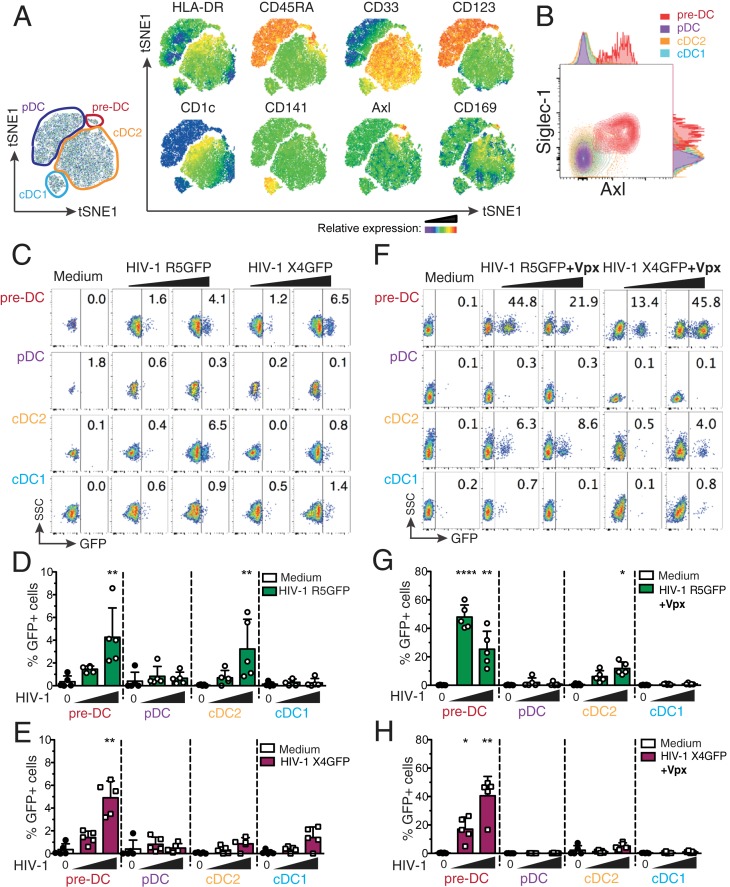
Comparative analysis of human blood DC subsets for their susceptibility to HIV-1 strains. (A) Representative tSNE plots of flow cytometry data from HLA-DR+Lin(CD3/CD14/CD16/CD19/CD34)– PBMCs, showing gates defining the indicated DC subsets and relative expression of the indicated markers. (B) Representative dot plot of Siglec-1 and Axl expression on pre-DCs (HLA-DR+Lin–CD33intCD45RA+CD123+Axl+), pDCs (HLA-DR+Lin–CD33−CD45RA+CD123+Axl−), cDC2s (HLA-DR+Lin–CD33+CD45RA−CD123−CD1c+), and cDC1s (HLA-DR+Lin–CD33+CD45RA−CD123−CD141+). (C) GFP expression in blood DC subsets sorted and infected for 48 h with HIV-1 R5GFP or X4GFP. Freshly prepared viral preparations used for the experiments depicted from C to H were titrated on GHOST reporter cells in parallel and used at a MOI of 0.994 ± 0.112 (mean ± SEM). Representative dot plot analyses are presented with the percentages of GFP+ cells indicated in each dot plot. (D) Quantification with HIV-1 R5GFP infection or (E) with HIV-1 X4GFP as in C, n = 5 independent donors combined from 3 experiments. Individual donors are displayed with bars representing mean ± SD. (F) As in C using the indicated viruses complemented with Vpx. (G) Quantification of infection with HIV-1 R5GFP or (H) with HIV-1 X4GFP, both supplemented with Vpx, n = 5 independent donors combined from 2 to 4 experiments. Individual donors are displayed with bars representing mean ± SD. *P < 0.05, **P < 0.01, ****P < 0.0001.

