Fig. 2.
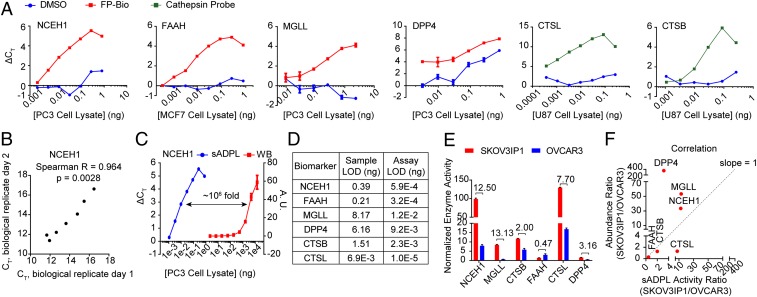
Ultrasensitive, specific activity measurements for diverse protein targets in whole proteome with sADPL. (A) sADPL signal profiles for 6 enzyme targets across whole proteome dilutions from the indicated cancer cell lines. ΔCT, cycle threshold normalized to no lysate (PBS) control. (B) Correlation plot of representative sADPL runs for NCEH1 activity performed on different days. Each data point represents 3 technical replicates within each biological replicate. (C) Side-by-side comparison of sADPL with Western blot detection of active and total NCEH1 in PC3 cell proteome, respectively. (D) Total proteome concentration limit of detection values for each enzyme, expressed for the sample and assay, which also accounts for dilution during sample processing. (E) Comparative sADPL profiling of active enzyme levels between aggressive (SKOV3IP1) and nonaggressive (OVCAR3) ovarian cancer cell lines. The mean activity ratio between lines is shown above each enzyme. (F) Plot correlating SKOV3IP/OVCAR3 activity ratio measured by sADPL (x-axis) and protein abundance measured by LC-MS/MS (y-axis). Spearman’s r = 0.66. All data points are from triplicate technical replicates from representative biological replicates in 2 or more biological experiments. Values represent the mean, and error bars represent the SD.

