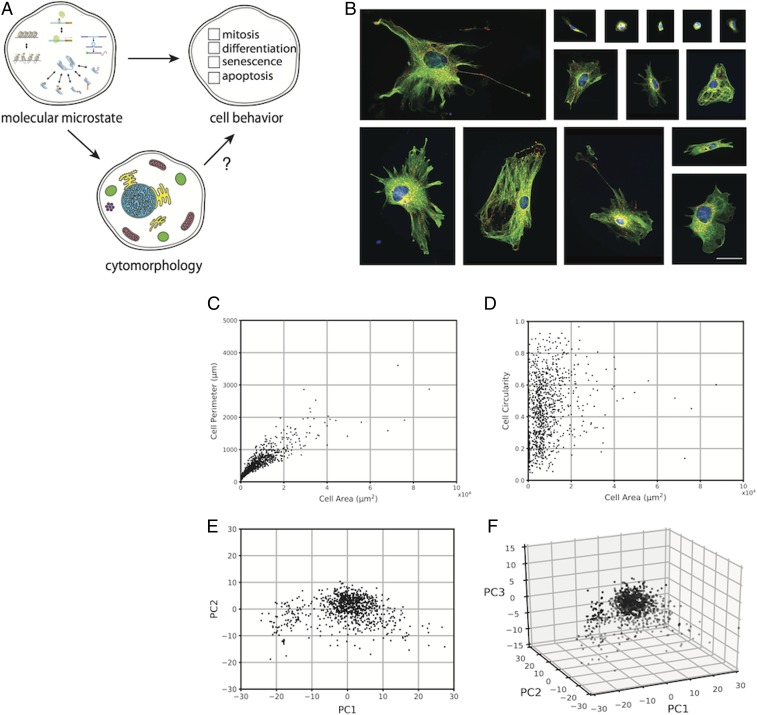
Fig. 1.
Cytomorphological heterogeneity in WT MEFs. (A) Relationships between cell states at different levels of description. (B) Fluorescence images of fixed WT MEFs. The microtubule cytoskeleton (α-tubulin, green), mitochondria (mtHsp70, red), and nucleus (DAPI, blue) are labeled. (Scale bar, 50 μm.) (C and D) Scatter plots of single cell values for cell area vs. cell perimeter (C) and cell area vs. cell circularity (D) in a sample of fixed WT MEFs (n = 904). (E and F) Scatter plots of single-cell coordinates in PC1 vs. PC2 (E) and PC1 vs. PC2 vs. PC3 (F) space in a sample of fixed WT MEFs (n = 904).

