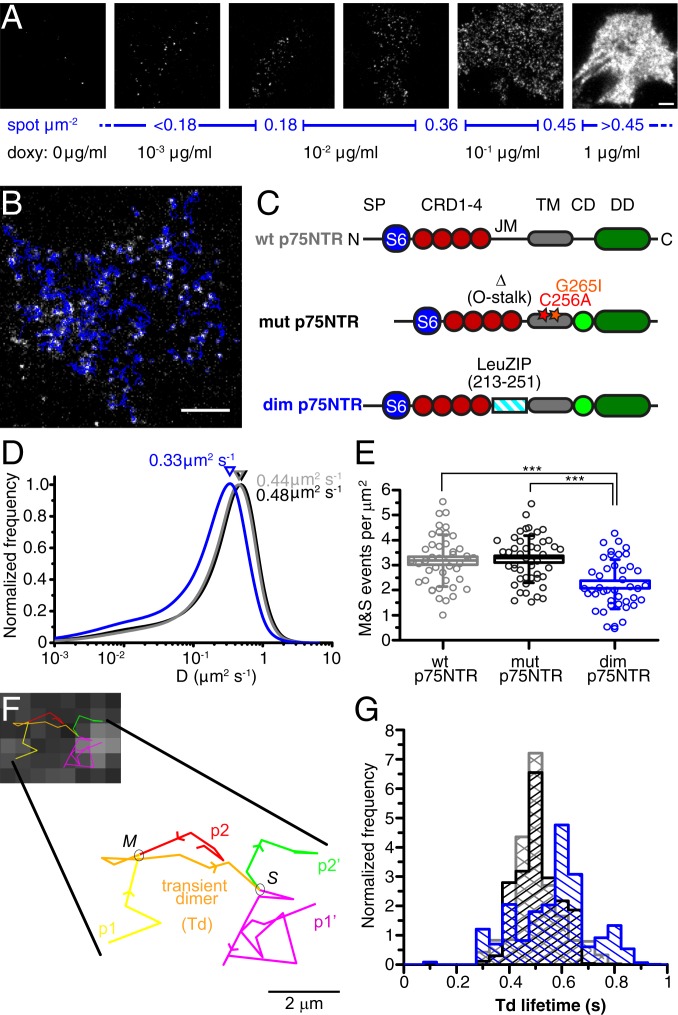
Fig. 2.
Membrane dynamics of p75NTR molecules in the cell membrane. (A) Expression of S6-p75NTR regulated by doxycycline (doxy). TIRF images of Abberior635P-labeled p75NTR receptors in SK-N-BE(2) cells show the dependence of the number of receptors per area (blue scale) on doxycycline concentration in the medium (black values below). (Scale bar, 5 μm.) (B) TIRF image of S6-p75NTR labeled with Abberior635P; superimposed trajectories are shown in blue. (Scale bar, 5 μm.) (C) S6-tagged constructs. The wt p75NTR is as in Fig. 1A; mut p75NTR bears mutations C256A and G256I, and lacks residues 221 to 246 encompassing the O-stalk domain in the JM region; and dim p75NTR has residues 213 to 251 of the JM portion replaced with the leucine zipper domain (LeuZIP) from c-jun. CD, chopper; DD, death domain; SP, signal peptide. (D) Distribution of D for wt p75NTR (gray), mut p75NTR (black), and dim p75NTR (blue). (E) Number of M&S events in 500-frame movies, normalized per membrane area, for wt p75NTR (gray), mut p75NTR (black), and dim p75NTR (blue). Boxes represent SE, lines represent median, and whiskers represent SD. ***P < 0.001, Kruskal–Wallis test. (F) TIRF frame with superimposed transient dimer trajectory, enlarged at the bottom for visualizing the merge (M) between p1 (yellow) and p2 (red) particles, their colocalization trajectory (orange) corresponding to a transient dimer (Td), and their split (S) in p1′ (magenta) and p2′ (green) particles. (Scale bar, 2 μm.) (G) Distribution of the cell-average duration of Td trajectories for wt p75NTR (gray), mut p75NTR (black), and dim p75NTR (blue) constructs. Cells with 0.18 to 0.36 receptor per square micrometer range were considered for these analyses.

