Fig. 3.
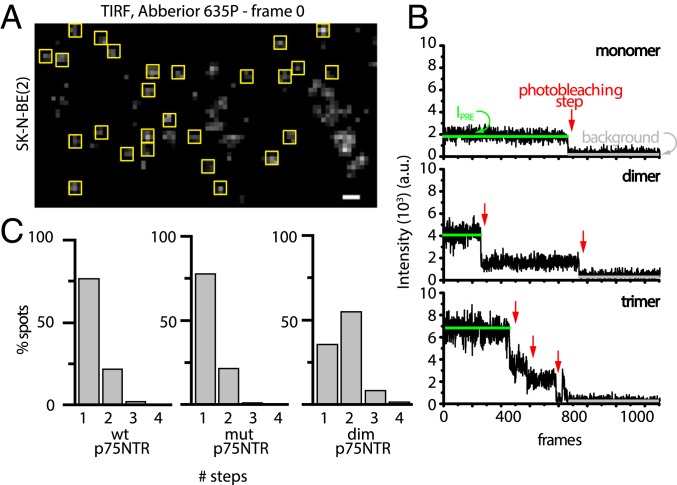
p75NTR is predominantly a monomer in the cell membrane. (A) TIRF image showing receptor spots on the surface of fixed cells (yellow squares represent analyzed spots; analyzed cells had 0.2 to 0.5 spot per square micrometer). (Scale bar, 1 μm.) (B) Typical intensity profile traces of a monomer (Top), dimer (Middle), and trimer (Bottom) showing the parameters considered in the calculation. IPRE (green line) is the particle average intensity before the first bleaching step, red arrows point to single photobleaching steps, and the gray line represents background intensity. a.u., arbitrary units. (C) Photobleaching steps per trace for wt p75NTR, mut p75NTR, and dim p75NTR.

