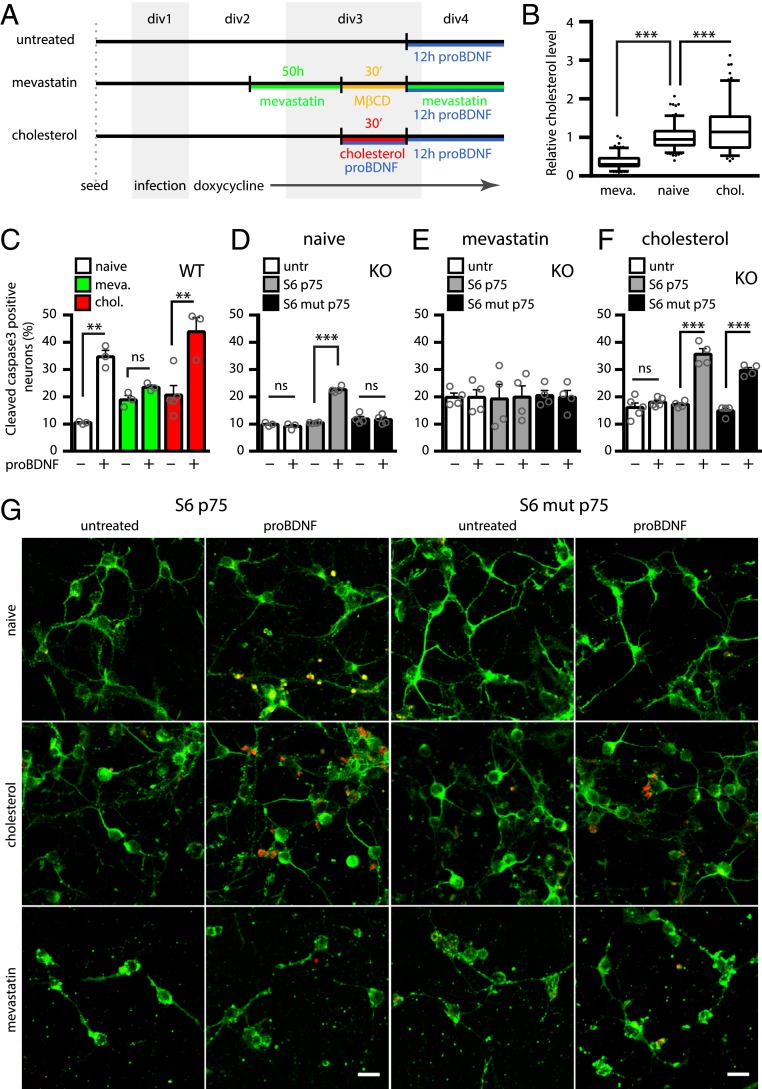
Fig. 5.
Membrane cholesterol regulates proBDNF apoptotic signaling via p75NTR. Experimental timeline (A) and quantification of cholesterol (intensity of filipin III staining) in cortical neurons treated with mevastatin/MβCD (meva.) or soluble cholesterol (chol.), relative to untreated neurons (B). ***P < 0.001, 1-way ANOVA (Tukey’s multiple comparisons). Box-plots represent 25th to 75th percentiles, whiskers indicate Tukey intervals, and dots represent outliers. div, day in vitro. (C) Percentage of cleaved caspase-3–positive neurons in wt cortical neurons (naive, white columns) or in the same neurons treated with mevastatin (green columns) or cholesterol load (red columns) in the absence or presence of proBDNF. (D) Percentage of cleaved caspase-3–positive neurons in untransduced p75NTR KO cortical neurons (untr [untransduced], white columns) or in the same neurons transduced with wt p75NTR (gray columns) or mut p75NTR (black columns) and induced with 0.05 μg/mL doxycycline, with or without proBDNF. White and gray columns are reported from Fig. 1F. The same is shown in conditions of cholesterol depletion (E, mevastatin) and cholesterol load (F, cholesterol) of the neurons. For C–F, **P < 0.01 and ***P < 0.001, 1-way ANOVA test (with Tukey’s comparison of means). ns, not significant at the 0.05 level. Bars are mean ± SEM, and superimposed dots represent samples. (G) Representative confocal images of neurons expressing wt p75NTR or mut p75NTR, untreated or treated with proBDNF. Naive neurons (Top), cholesterol-enriched (cholesterol) neurons (Middle), and cholesterol-depleted (mevastatin) neurons (Bottom) are shown. MAP2 (green) and cleaved caspase-3 (red) are indicated. (Scale bars, 20 μm.)

